Overview
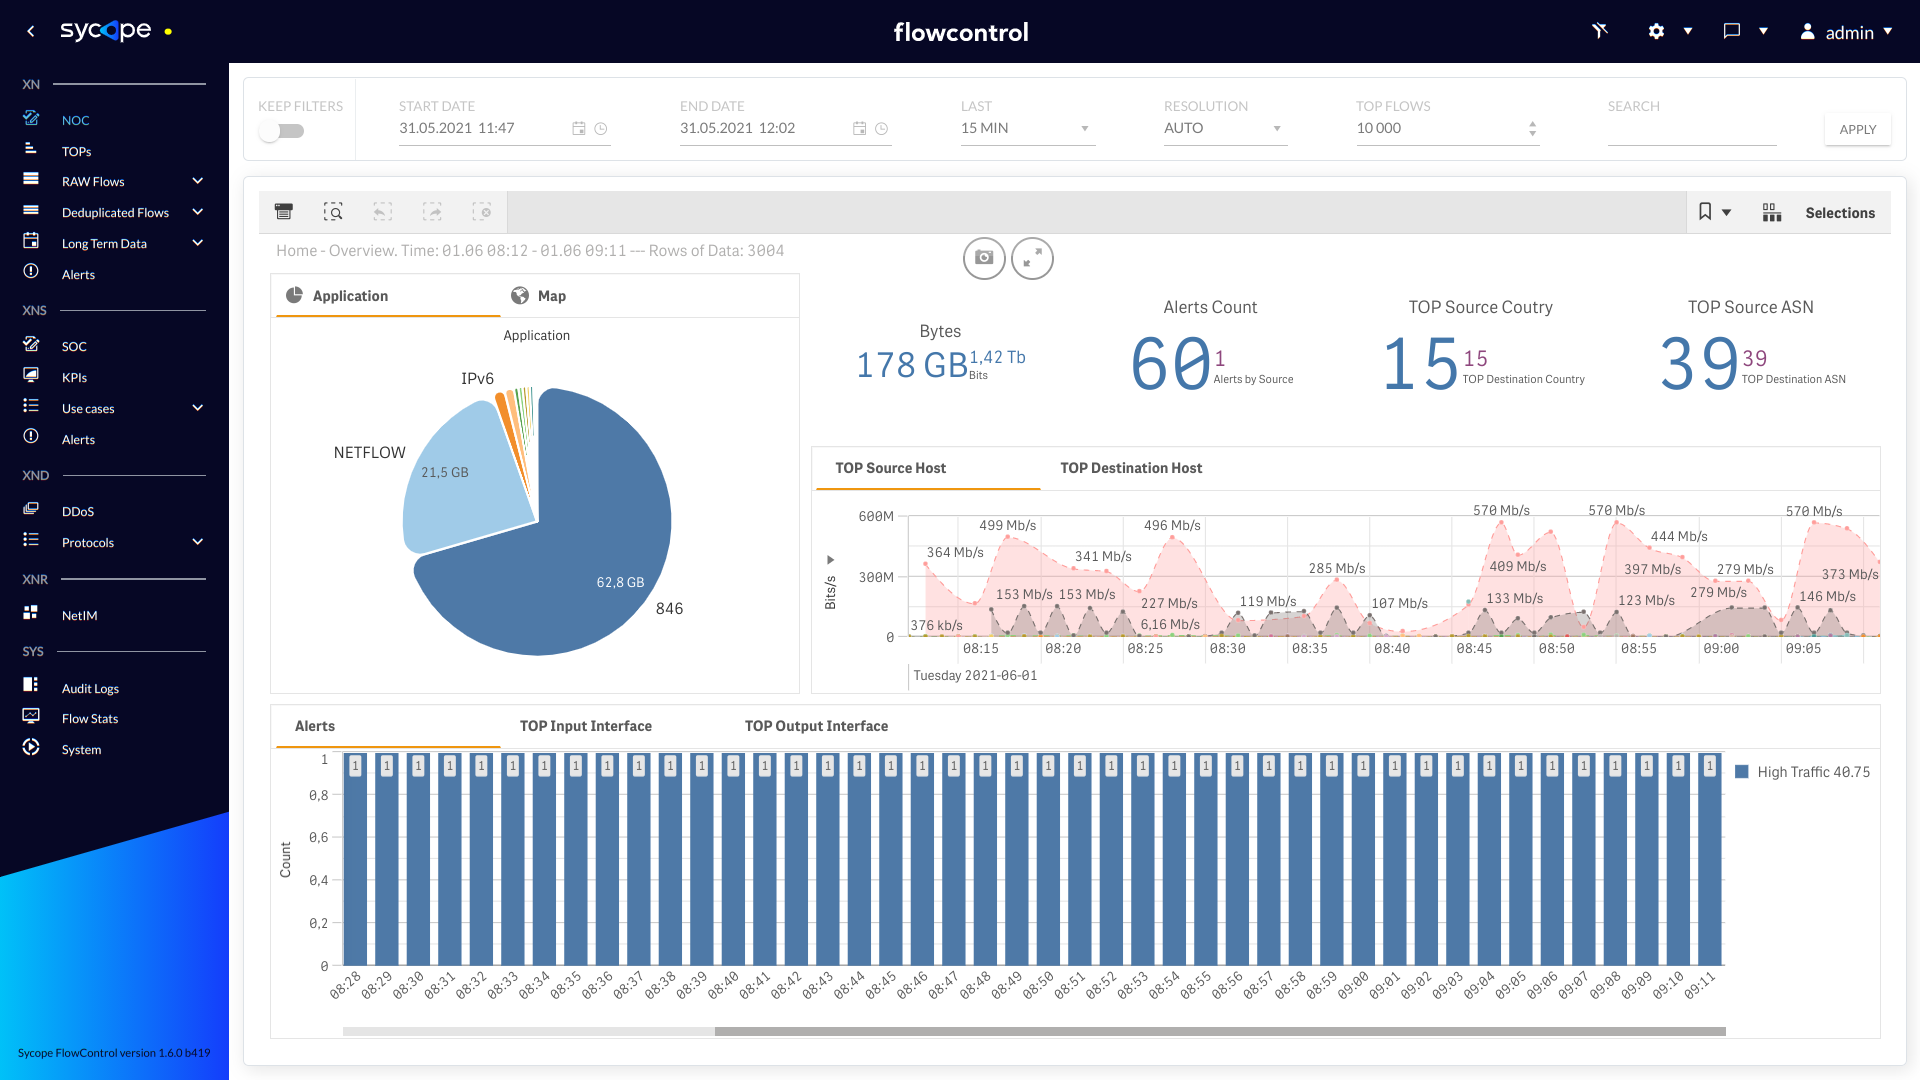
The main option to configure the solution is the web GUI. The most important thing to notice when working with the FlowControl System are the menus on the left-hand side (XN, XNS, XND, XNR, SYS) and the icons in the top right corner (Configuration options). They are all vital components for working with the system, effective problem identification and data mining.
Main
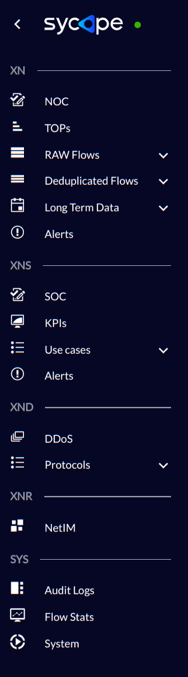
On the left side there are four main sections: XN, XNS, XND, XNR and SYS. Each section consists of a menu where you will find desired information about collected data and system configuration. The main section works in hide/reveal mode. In order to show full names of the menu components, minority and majority please click on the minority sign icons ( < ) located at the top left corner. In order to hide the menu, please click the minority sign icons ( > ).
Below is presented table with general description of what can be found in each section. Elements of the main menu were emphasized, while elements of the submenu were written in plain text.
| FlowControl XN | Description |
|---|---|
| NOC | General overview of network infrastructure parameters |
| TOPs | Information about top talkers in the network. |
| RAW Flows | Detailed information about traffic. |
| Raw Data | Extensive information about every flow in the traffic. |
| ASA Devices | Detailed information about flows from ASA Devices. |
| Deduplicated Flows | Information about deduplicated flows. |
| Traffic | Network traffic based on deduplicated flows. |
| Applications | Network traffic analysis in view of application based on deduplicated flows. |
| Geolocalization | Maps with various geolocations. |
| Groups | Flows organized into various groups, e.g. business roles, location. |
| AS Names | Flows organized according to AS Names. |
| Long Term Data | Aggregated date from previous time periods. |
| Last Day | Aggregated data from last day. |
| Last Week | Aggregated data from last week. |
| Last month | Aggregate data from last month |
| Alerts | Information and details about alerts that occurred in the network. |
Note: All views except Raw Data use deduplicated traffic. In order to see unique information about flows that may change on the flow path, e.g. QoS tags – please use Raw Data views.
| FlowControl XNS | Description |
|---|---|
| SOC | General overview of security aspects of the network. |
| KPIs | General overview of the basic values of alerts. |
| Use Cases | Monitoring scenarios of IT security threat. |
| Threat Analysis | Information on all threats. |
| External Threats | Information on threats outside the customer network. |
| Internal Threats | Information on threats inside the customer network. |
| Alerts | Table with all information about alarms in the system. |
| FlowControl XND | Description |
|---|---|
| DDOS | Information about DDoS attacks. |
| Protocols | Network traffic characteristics in the context of DDoS attacks. |
| Overview | Network traffic characteristics in the context of protocols. |
| Details | Detailed information about DDoS attacks. |
| System Section | Description |
|---|---|
| Audit Logs | Information on users logins. |
| Flow Stats | General statistics about raw and aggregated flows. |
| System | Disk utilization information. |
The DOT on the right side of the logo (as shown below) indicates the system status, in this case system events and network alerts.
![]()
The DOT takes on four colors depending on the event/alert:
- green,
- yellow,
- red,
- blue.
When the color of the dot changes, a popup appears with the text describing the event. When an event occurs, apart from the fact that it is indicated by a change of color of the dot, a window pops up in the lower right corner of the screen with information about the event/alarm.
Event/alarm information is also available by pointing the dot with the mouse pointer.
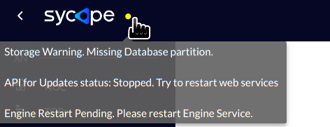
Below is a list of all events/alerts that are indicated by the dot:
| Message | Color |
|---|---|
| System does not signal any events/alerts. | green |
| "API for Updates status: Stopped. Try to restart web services" | yellow |
| "API for SNMP status: Stopped. Try to restart other services" | yellow |
| "API for Restarts status: Stopped. Try to restart other services" | yellow |
| "API for Configs status: Stopped. Try to restart web service" | yellow |
| "Storage Warning. Missing Database partition." | yellow |
| "Storage on Database partition is less than 5GB." | yellow |
| "Storage on Cache partition is less than 5GB." | yellow |
| "Storage on System partition is less than 5GB." | yellow |
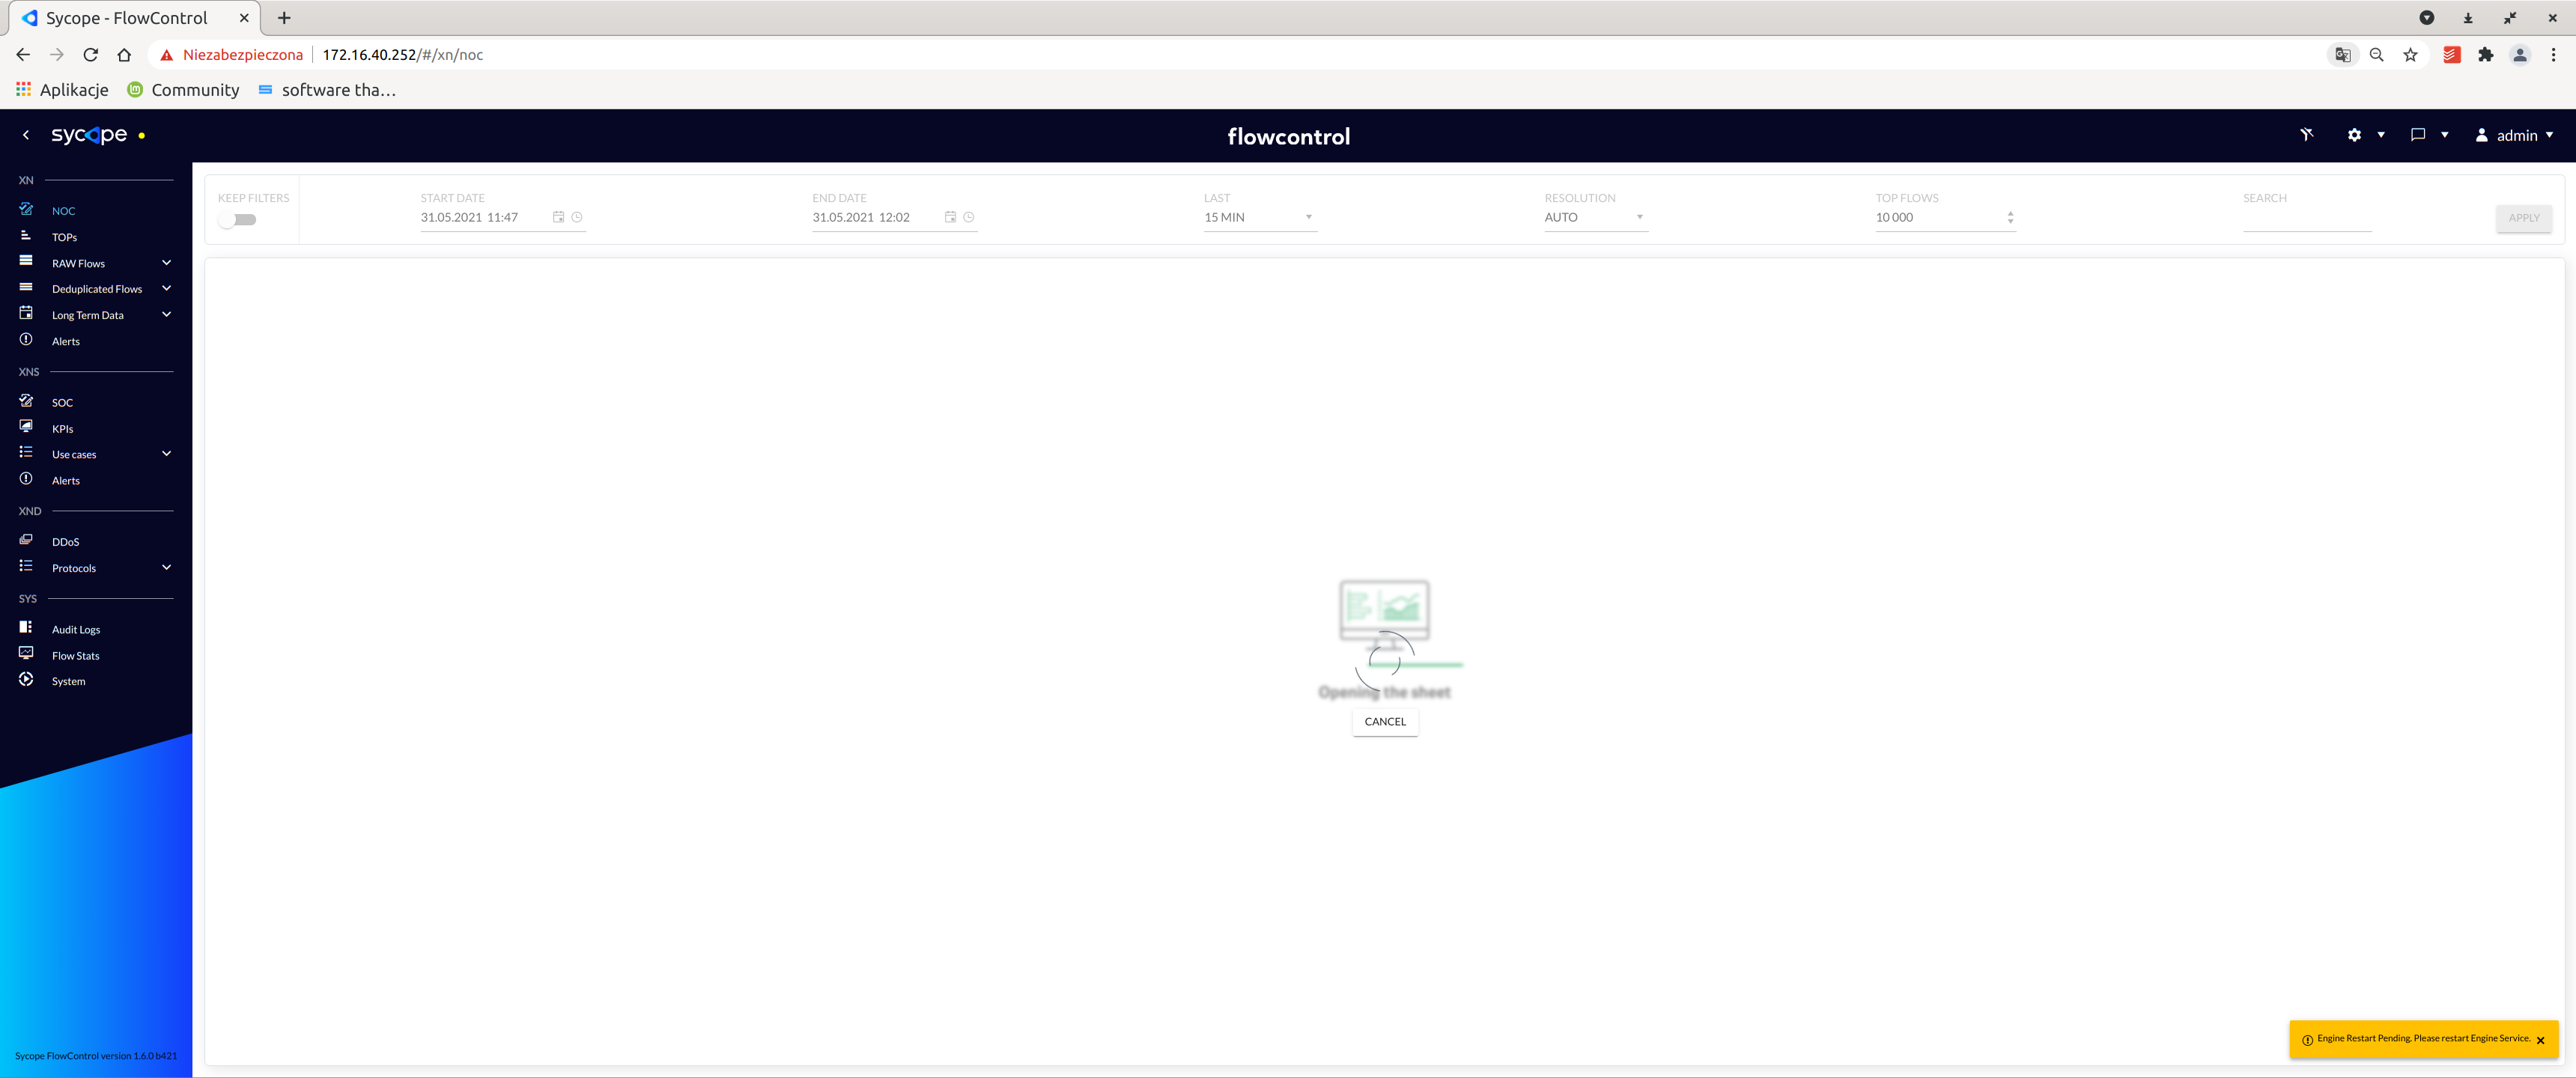
| "Engine Restart Pending. Please restart Engine Service" | yellow |
| "API for Authentication status: Stopped. Try to restart web services" | red |
| "API for Reloads status: Stopped. Try to restart web services" | red |
| "Database Services status: Stopped (Running $QlikServicesCount/8). Try to restart database" | red |
| "Engine Fatal Error. Netflow Engine status: $Engine. Try to restart engine" | red |
| "Storage Fatal Error. Missing Cache partition. Restart server is required." | red |
| "ESXi CPU Configuration Error. Logical CPUs are less than 8. There should be max 2 sockets on Esxi CPU configuration. Actual logical CPUs: $cores" | red |
| "New Update is available for download. $updateVersion." | blue |
Configuration
On the right-hand side of the system there are three drop-down menus and one switch . The switch is used to hide the date selection and overload bar. The first menu, marked with this icon , is the settings menu available only for admin accounts. This section is described in the *Administration Settings* paragraph. The second drop-down menu, marked with , is available for all users. Things that can be found in this section are :
- License Info,
- User Guide,
- Documentation,
- About.
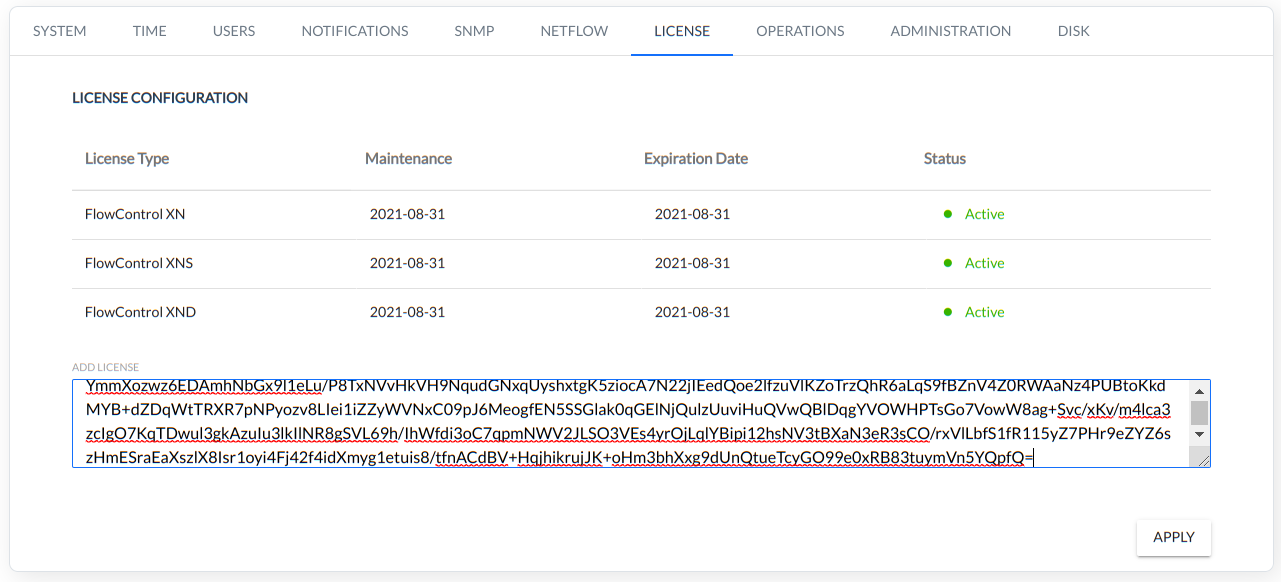
The license is delivered as a text file. To activate the license, the text from the delivered file must be copied into to the field “Add License” [settings menu/config/license] as below.
Important note:
The standard license includes one administrator account and two user accounts.
Notice:
If there is no license in the system it is not possible to:
- add user,
- update software,
- collect Netflow.
The user guide will redirect users to the documentation stored on the system. The about section system will take users to the general web page with information about https://www.sycope.com/.
The third drop down menu , available for all users. In this menu the following things can be found:
Profile
- User Settings
- Change Password
- User Time Zone
Logout
Administration Settings
The administrator can change and personalize various aspects of the FlowControl environment. Configuration options that can be set up in this menu are the options required to properly configure and maintain the FlowControl system.
The following options are available for selection in the administration menu:
- Alerts
- Config
- Security
- Mapping
- Reports

Alerts
There are two tabs available in the Alerts menu:
- Alerts
- Notifications
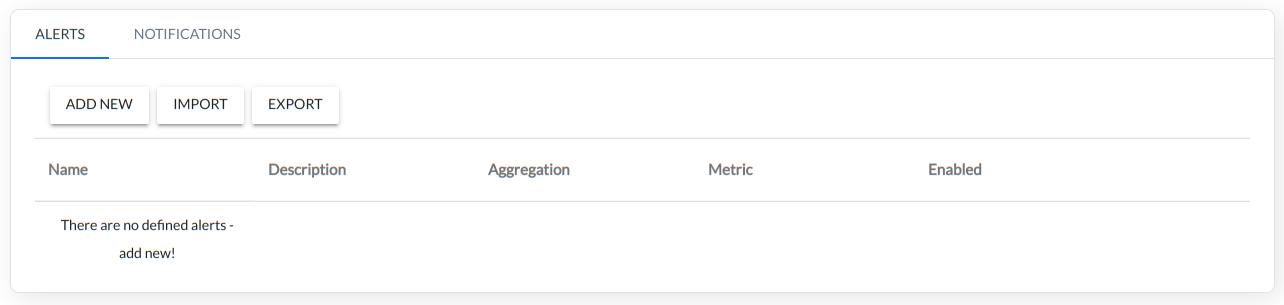
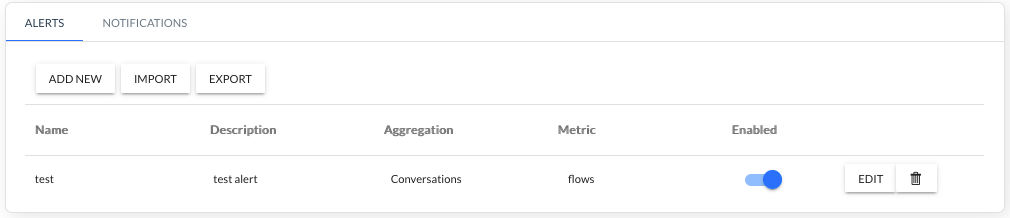
Alerts tab
From version 1.6 FlowControl provides an advanced alarm wizard that allows the user to flexibly configure alarms based on multiple aggregations, parameters/fields, metrics, using a number of operators.
The alarm configuration consists of four steps:
- INITIAL
- OBJECT FILTER
- METRICS
- SUMMARY
To configure alarm in the first step, add a new alarm ADD NEW in the ALERTS tab.
The wizard is started - a window appears with the first step of alarm configuration.
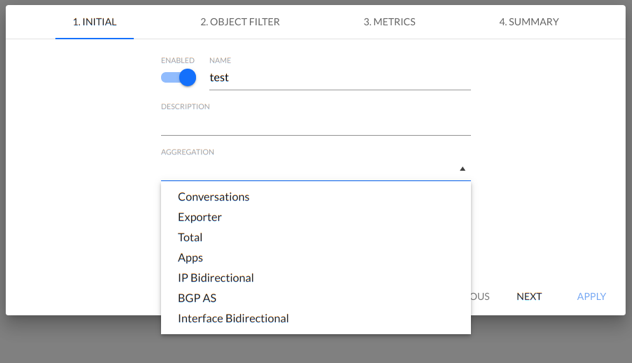
1. INITIAL
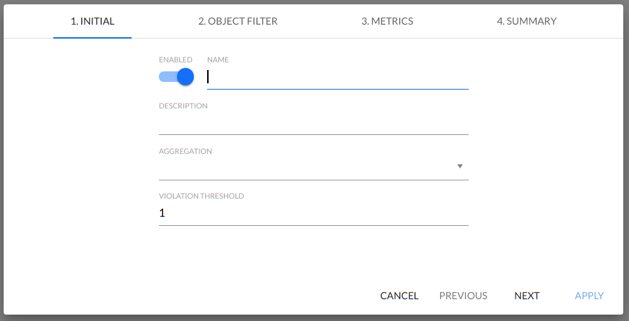
At this point, the system provides four fields:
- ENABLE - Alarm activation/deactivation,
- NAME - user assigned alarm name,
- DESCRIPTION - alarm description (optional),
- AGGREGATION - select the aggregation on which the alarm is based:
- Conversation,
- Exporter,
- Total,
- Apps
- Ip Bidirectional,
- BGP AS,
- Interface Bidirectional.
VIOLATION THRESHOLD - This field indicates how many intervals (minutes) the alarm parameters must be exceeded for a given alarm to be triggered.
ENABLE - switch used to alarm enable/disable.
After accepting the first configuration step APPLAY, NEXT is used to start the second configuration step.
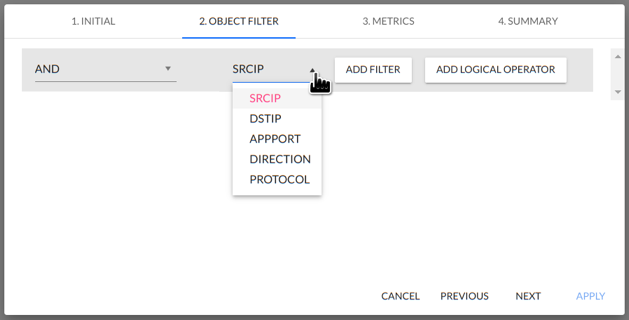
2. OBJECT FILTER
Each aggregation in the system has a number of parameters/fields and metrics based on which a filter can be created such as SRIP, DSTIP and so on. In this step the user can select parameters and combine them with filters and logical operators.
The following is a list of available aggregations with their associated parameters/fields and metrics.
| Agregation | Parameter/Field | Metric |
|---|---|---|
| Conversation | srcip dstip appport direction protocol | flows packets octets |
| Exporter | exporterip inputint outputint mplstoplabelexp type mplslabel1 mplslabel2 mplslabel3 mplslabel4 mplslabel5 | flows packets octets |
| Total | - | flows packets octets |
| Apps | appport direction proto | flows packets octets |
| IP Bidirectional | ip | octetsin octetsout flowsin flowsout packetsin packetsout |
| BGP AS | srcas dstas | flows packets octets |
| Interface Bidirectional | exporterip int | octetsin octetsout flowsin flowsout packetsin packetsout utilin utilout |
In turn, to each parameter/field are assigned appropriate operators such as EQUALS, NOT EQUALS, MATCHES and so on.
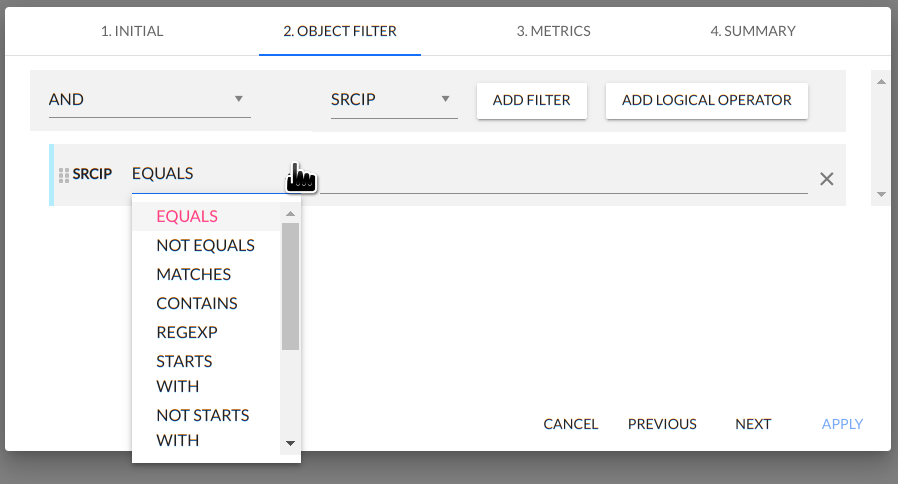
The following is a list of operators associated with the relevant parameters/fields:
| Parameter/Field | Operator |
|---|---|
| srcip | equals not equals matches contains regexp starts with not starts with ends with not ends with is in subnet is not in subnet |
| dstip | equals not equals matches contains regexp starts with not starts with ends with not ends with is in subnet is not in subnet |
| appport | lower than lower or equal than greater than greater or equal than equals not equals matches contains regexp starts with not starts with ends with not ends with |
| direction | lower than lower or equal than greater than greater or equal than equals not equals matches contains regexp starts with not starts with ends with not ends with |
| protocol | lower than lower or equal than greater than greater or equal than equals not equals matches contains regexp starts with not starts with ends with not ends with |
| exporterip | equals not equals matches contains regexp starts with not starts with ends with not ends with is in subnet is not in subnet |
| inputint | lower than lower or equal than greater than greater or equal than equals not equals matches contains regexp starts with not starts with ends with not ends with |
| outputint | lower than lower or equal than greater than greater or equal than equals not equals matches contains regexp starts with not starts with ends with not ends with |
| int | lower than lower or equal than greater than greater or equal than equals not equals matches contains regexp starts with not starts with ends with not ends with |
| mplstoplabelexp | lower than lower or equal than greater than greater or equal than equals not equals matches contains regexp starts with not starts with ends with not ends with |
| type | lower than lower or equal than greater than greater or equal than equals not equals matches contains regexp starts with not starts with ends with not ends with |
| mplslabel1 | lower than lower or equal than greater than greater or equal than equals not equals matches contains regexp starts with not starts with ends with not ends with |
| mplslabel2 | lower than lower or equal than greater than greater or equal than equals not equals matches contains regexp starts with not starts with ends with not ends with |
| mplslabel3 | lower than lower or equal than greater than greater or equal than equals not equals matches contains regexp starts with not starts with ends with not ends with |
| mplslabel4 | lower than lower or equal than greater than greater or equal than equals not equals matches contains regexp starts with not starts with ends with not ends with |
| mplslabel5 | lower than lower or equal than greater than greater or equal than equals not equals matches contains regexp starts with not starts with ends with not ends with |
| srcas | lower than lower or equal than greater than greater or equal than equals not equals matches contains regexp starts with not starts with ends with not ends with |
| dstas | lower than lower or equal than greater than greater or equal than equals not equals matches contains regexp starts with not starts with ends with not ends with |
The system has a very flexible mechanism for creating rules. Individual rows of rules can be nested and combined using operators, depending on the user's needs and creating complex/expanded expressions.
Relationships between rows can be specified using the three operators AND, OR, and NOT.
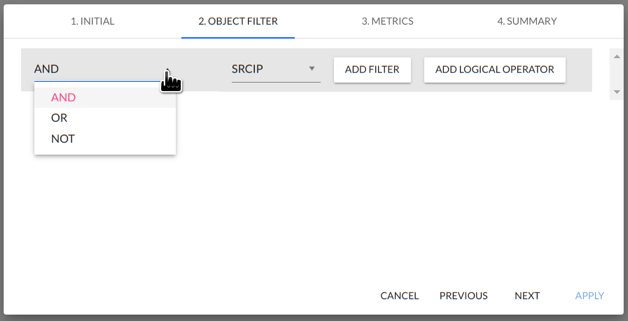
It is possible to move the rows and swap positions by clicking and holding the left mouse button on the left side of the row.
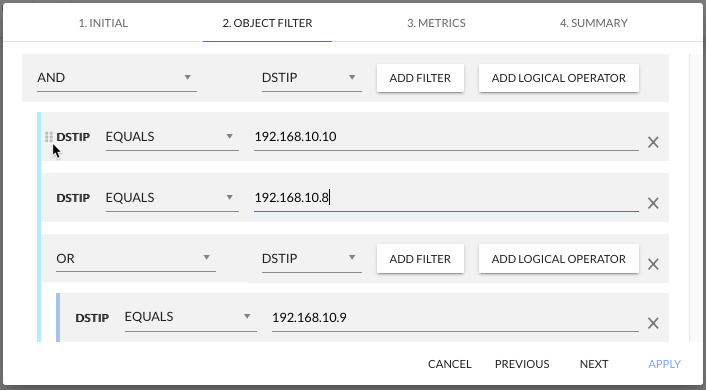
In the example above, the logical expression for the alarm is as follows:
ALARM=(DSTIP EQUALS to 192.168.10.10) AND (DSTIP EQUALS to 192.168.10.8) OR (DSTIP EQUALS to 192.168.10.9)
The third configuration step allows the user to select metrics for the filters previously configured in step two.
3. METRICS
This configuration step allows to configure the alarm triggers by specifying a metric value for a pre-selected aggregation, an alarm trigger operator, and specifying value levels for the three alarm levels.
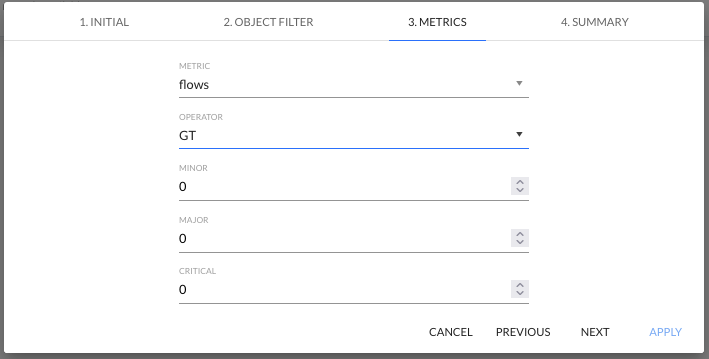
In this step, specify the parameters for the following fields:
- METRICS
- flows,
- packets,
- octets.
- OPERATOR
- GT - greater than,
- LT - lower than.
- MINOR - numerical value for the minor alarm threshold
- MAJOR - numerical value for the major alarm threshold
- CRITICAL - numerical value for the critical alarm threshold
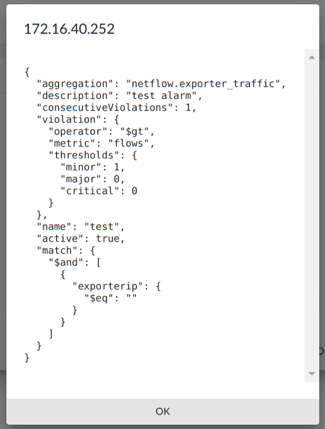
4. SUMMARY
The window in step four shows a summary of the most important parameters for the alarm being configured :
- NAME - Alert name.
- ACTIVE - status Enable/Disable.
- AGGRATION - Alert selected aggregation.
- METRICS - Alert selected metric.
- CONSECUTIVEVIOLATIONS is equal to VIOLATION THRESHOLD - This field indicates how many intervals (minutes) the alarm parameters must be exceeded for a given alarm to be triggered.
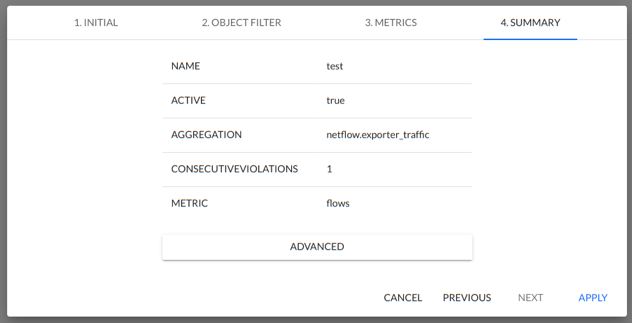
After confirming the configuration process with APPLY button, the configured alarm appears in the list of created alarms.
NOTE: After accepting the alarm configuration (APPLY), RESTART Engine Service must be performed to activate the alarm:
ADVANCE - Configure an alarm by importing a JSON script.
The FlowControl system allows to configure the alarm by importing a file in JSON format. The ADVANCE button opens a window with the alarm configuration in JSON format.
Example script:
{
  "aggregation": "netflow.exporter_traffic",
  "description": "test alert",
  "match": {
    "$and": [
      {
        "exporterip": {
          "$eq": "192.168.10.101"
        }
      }
    ]
  },
  "violation": {
    "operator": "$gt",
    "metric": "flows",
    "thresholds": {
      "minor": 2,
      "critical": 0,
      "major": 0
    }
  },
  "name": "import_test",
  "active": true,
  "consecutiveViolations": 1
}
The script prepared and saved to disk as a file is imported using THE IMPORT button.
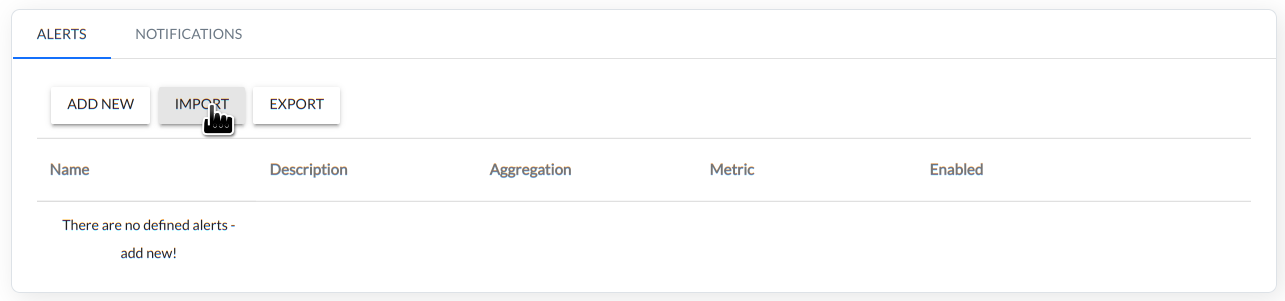
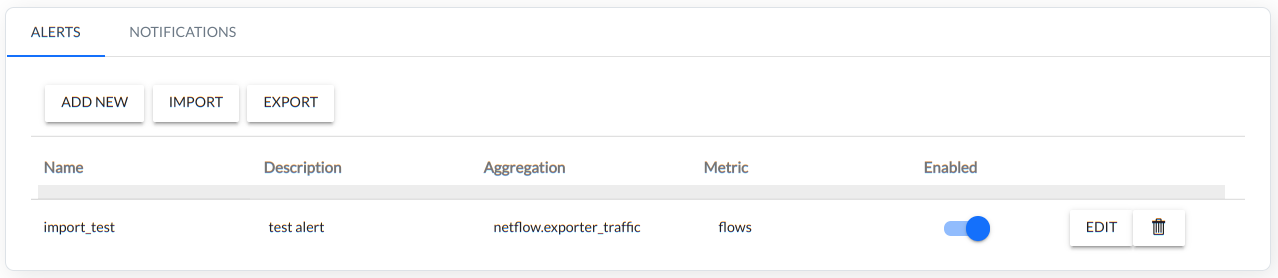
After the import of the script the alarm appears in the list of created alarms. The imported alarm can be edited in the same way as the alarm created by the configurator.
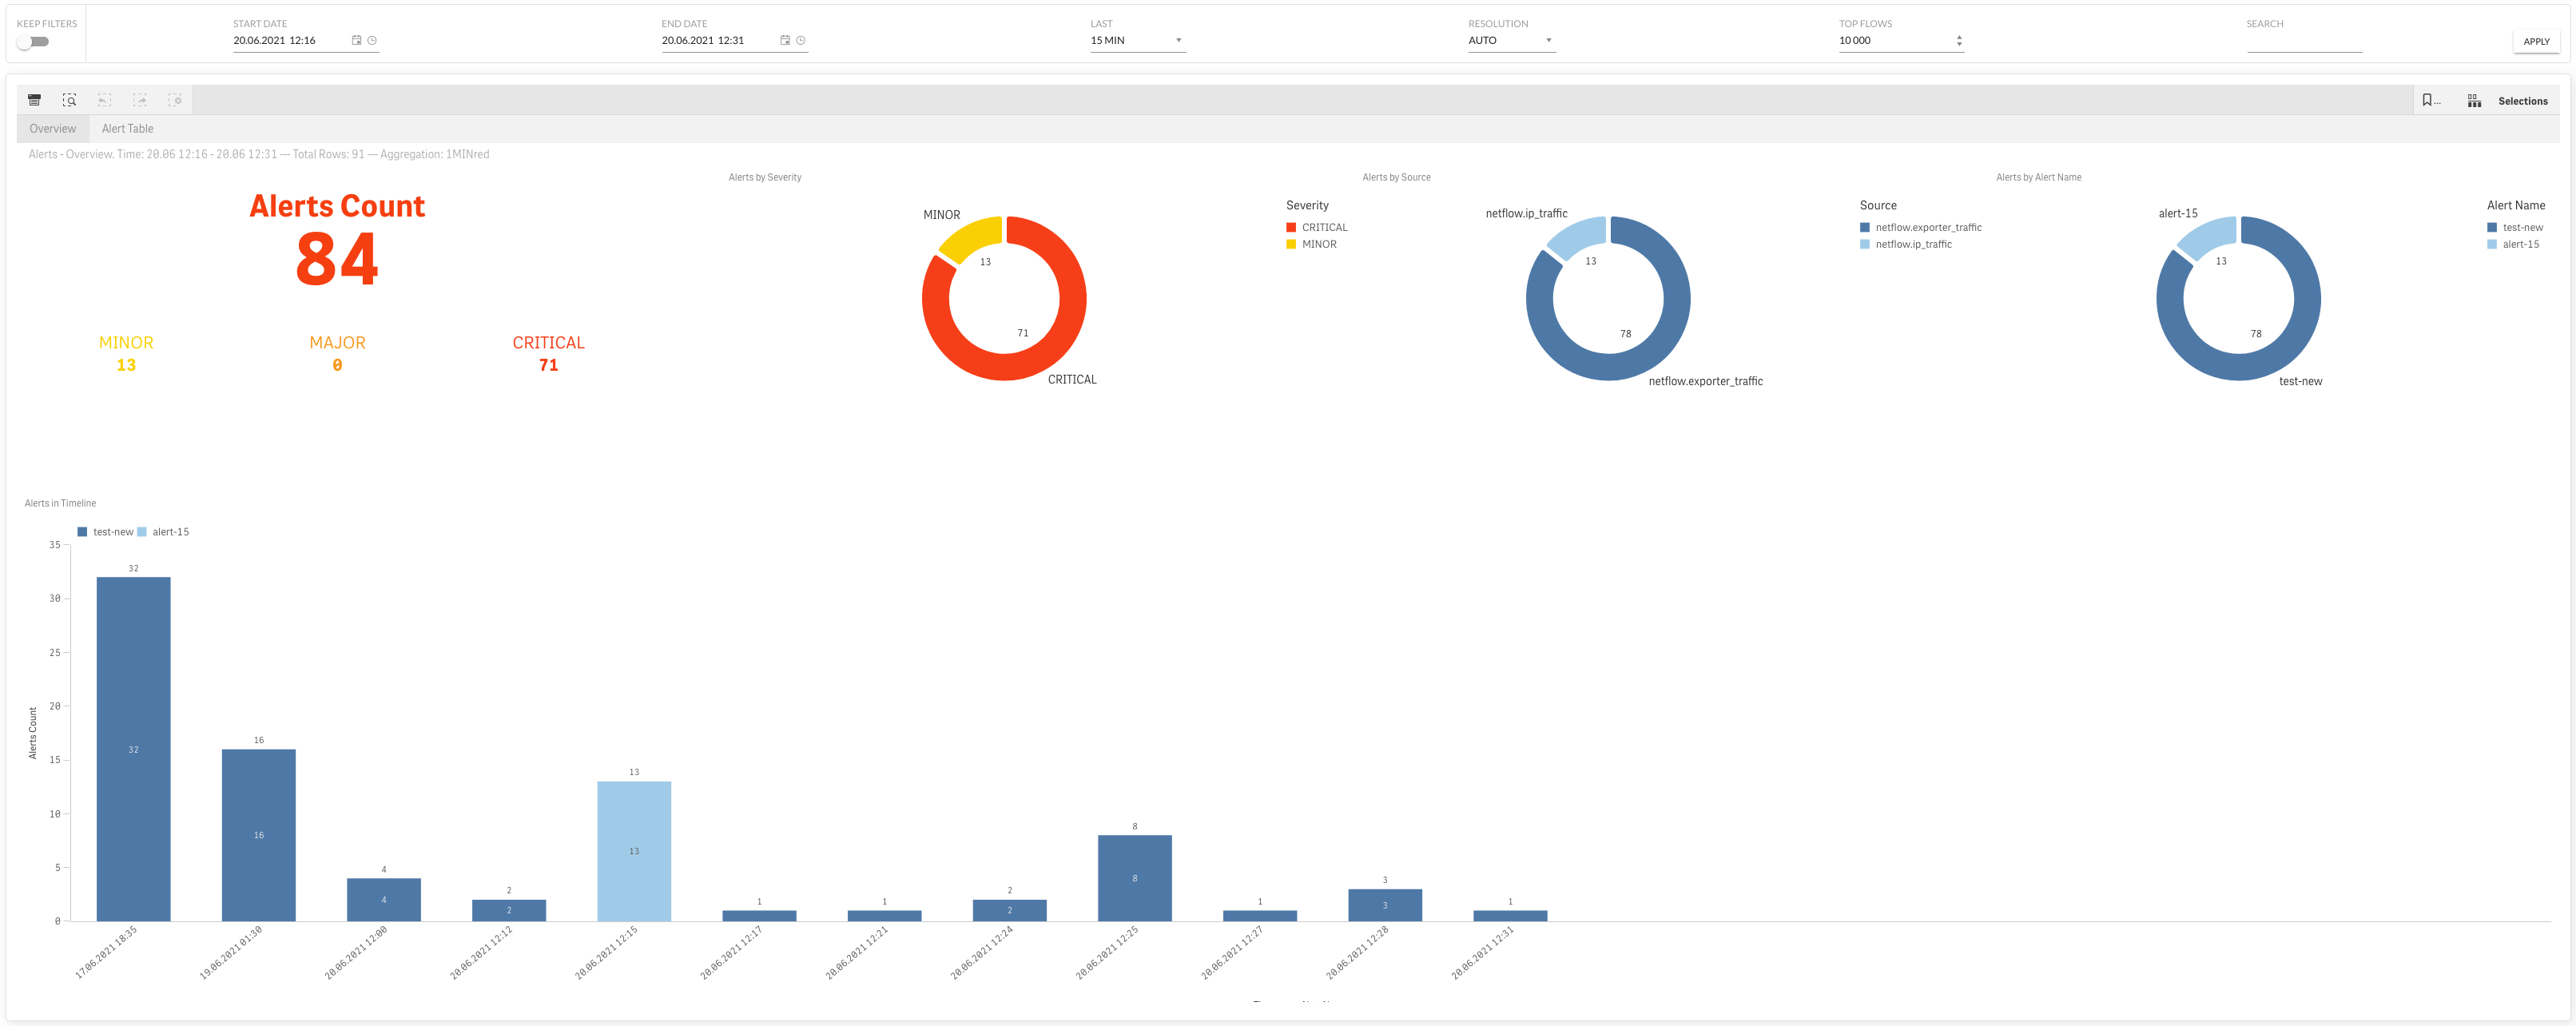
The current alarms status (new/ongoing/update/closed) is shown in the graphs on the XN->Alert->Overview view.
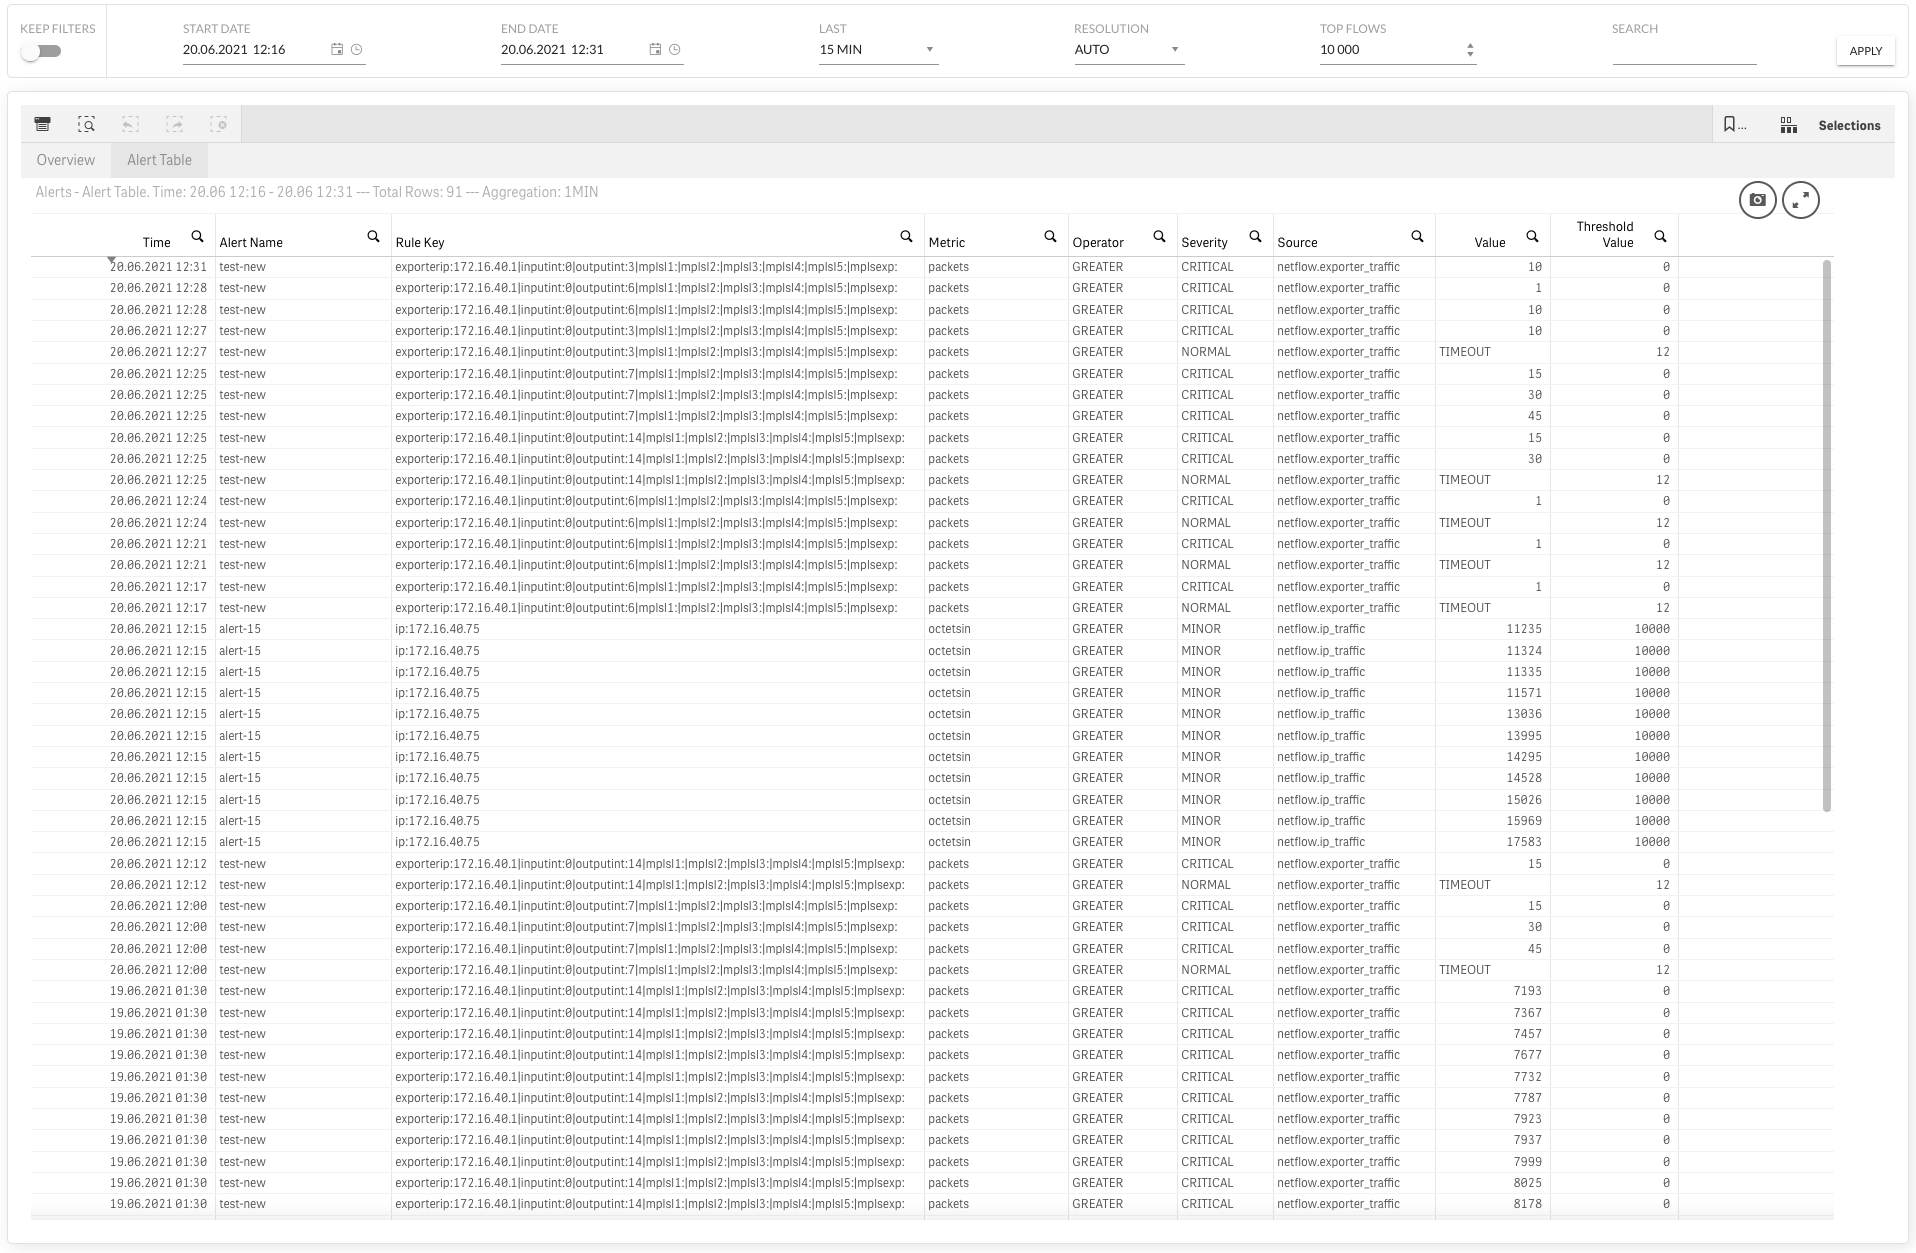
The current alarms status with configuration parameters is also available in tabular form shown in XN->Alert->Alert Table
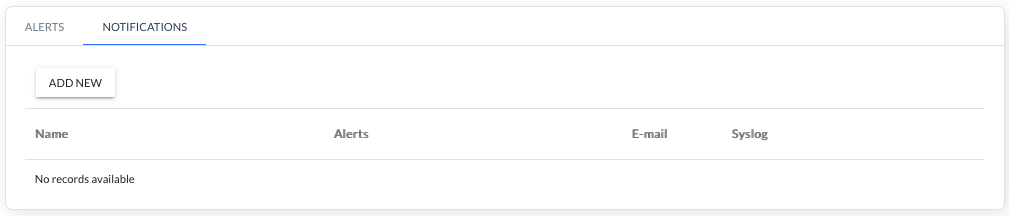
Notification tab
FlowControl has extensive alarm notifications capabilities which are configured in the NOTIFICATION tab. To add a new notification, use the ADD NEW button.
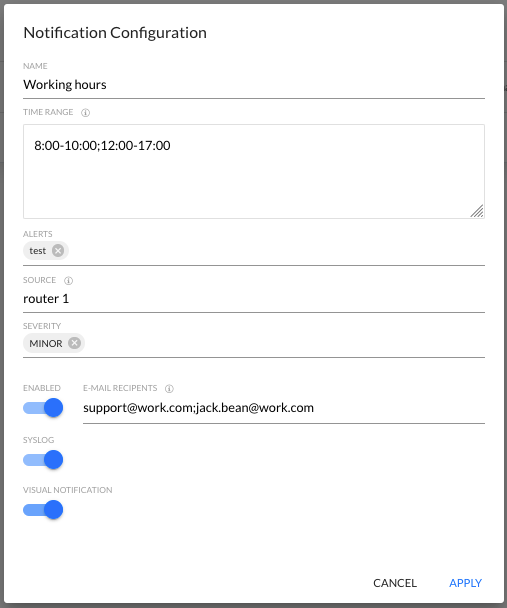
Then the Notification Configuration window opens.
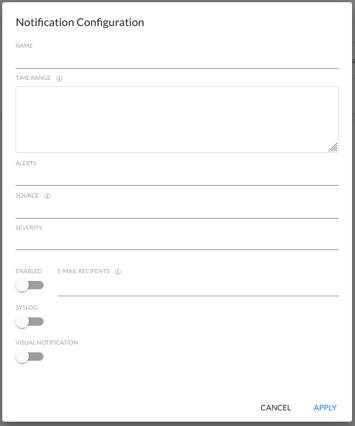
The pane has the ability to fill in the following fields:
- NAME - User-defined notification name
- TIME RANGE - the times when notifications are activeadresy
- ALERTS - Alarm(s) to be notified
- SOURCE - User-defined name of alarm source(s)
- SEVERITY
- MINOR
- MAJOR
- CRITICAL
- E-MAIL RECIPENTS - e-mail addresses to which notifications should be sent
- ENABLE switch - enable or disable the sending of notifications to the entered e-mail addresses
- SYSLOG switch - enable or disable the sending of notifications to syslog
- VISUAL NOTIFICATION switch - enable or disable pop-up notifications
Here is an example of a filled window with notification configuration:
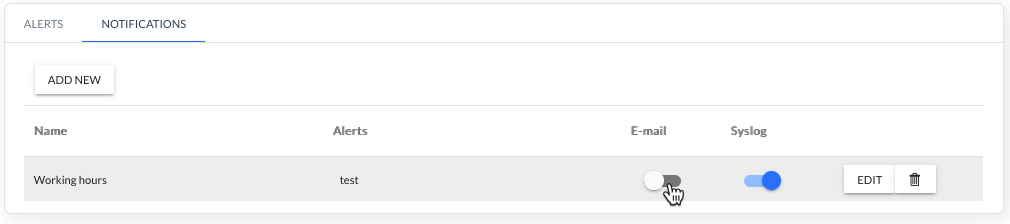
After the configuration is confirmed with the APPLY button, the notification appears on the list of created notifications.
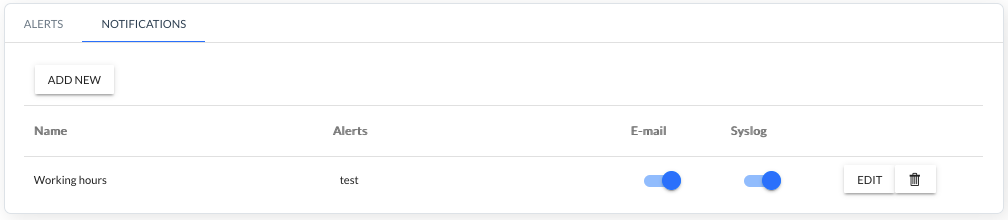
Enabling or disabling the sending of notifications to e-mail addresses and Syslog is also possible using the switches on the notification list.
Config
In the Config section users can configure main system aspects. Options available here are:
- SYSTEM
- TIME
- USERS
- NOTIFICATIONS
- SNMP
- NETFLOW
- LICENSE
- OPERATIONS
- ADMINISTRATION
- DISK
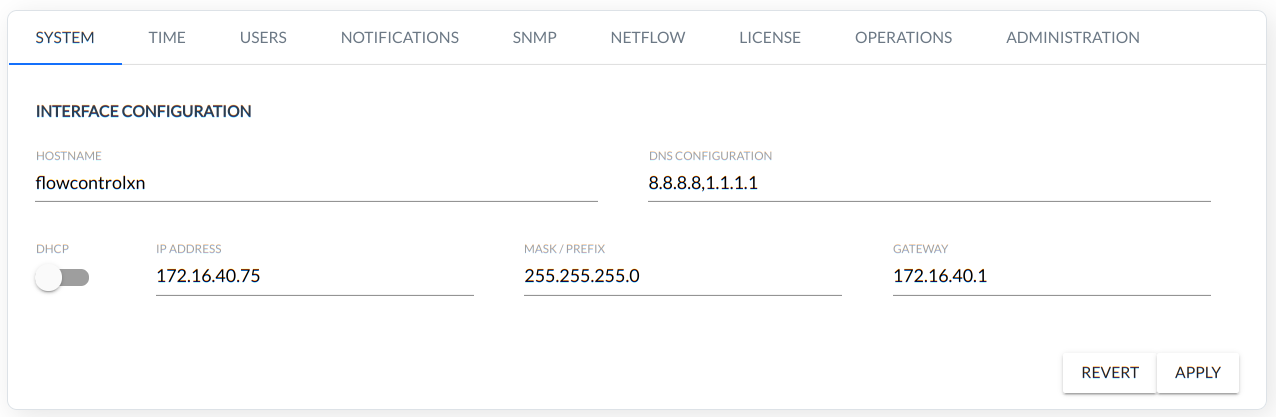
SYSTEM
Basic network configuration: Hostname, DNS and IPv4, IPv6 address, DHCP and Gateway.
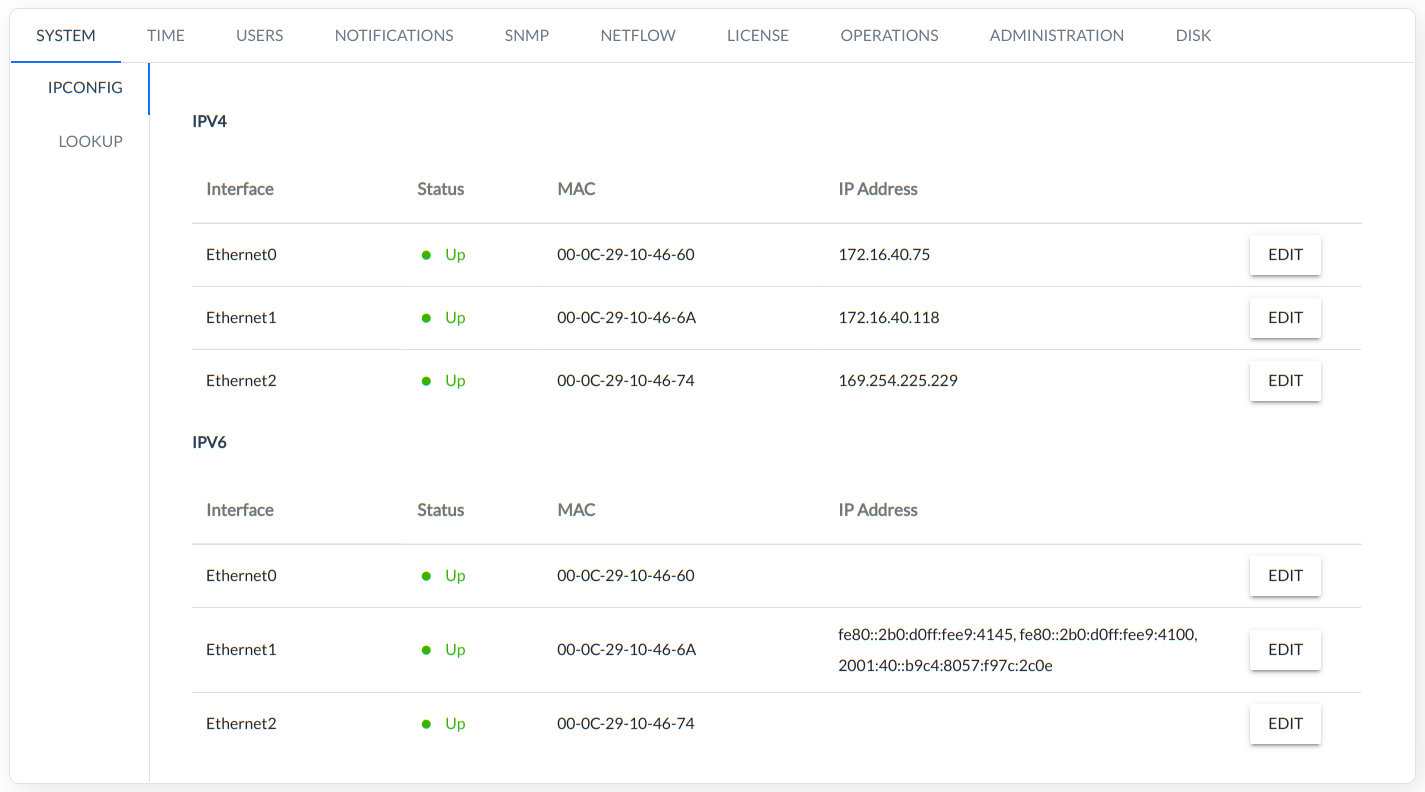
IPCONFIG
The interface configuration is shown in the figure below:
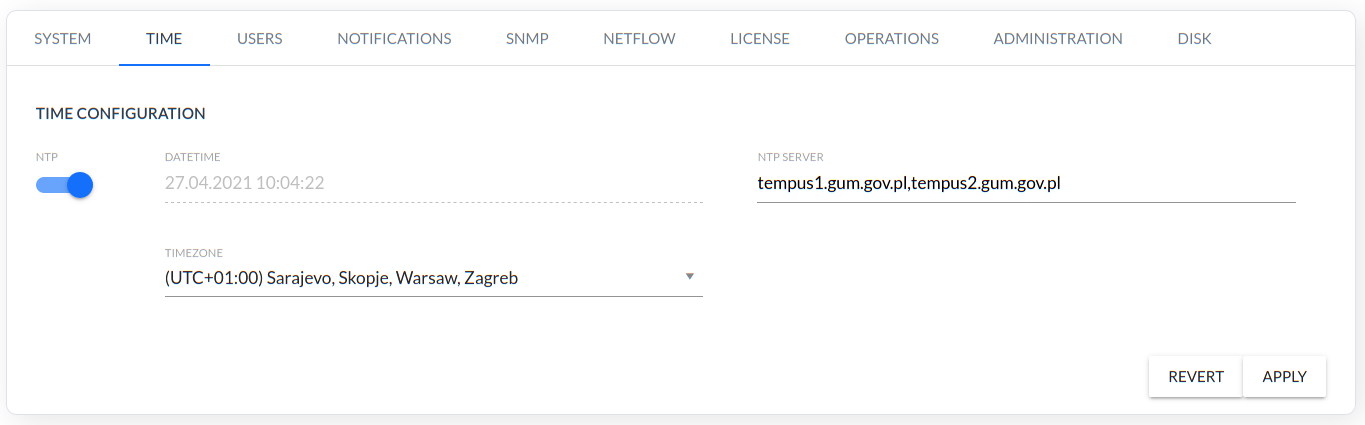
TIME
Manual or NTP server configuration.
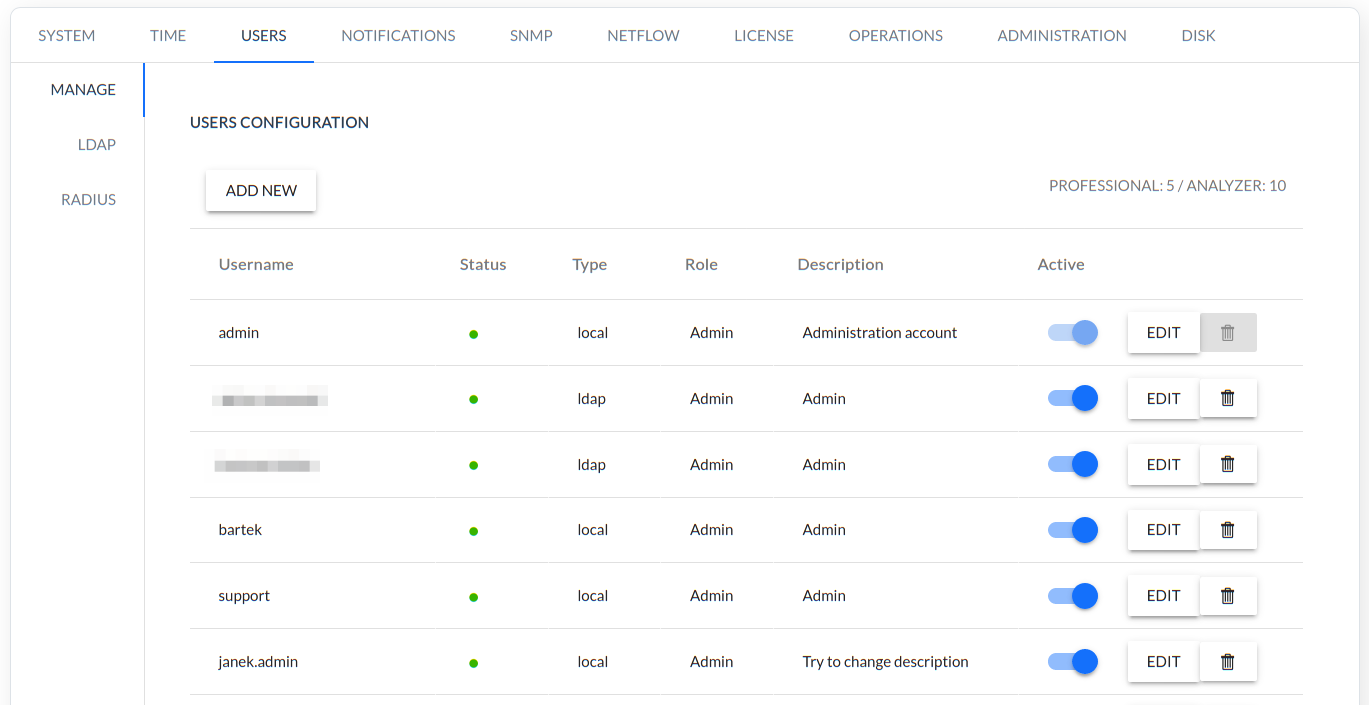
USERS
System user configuration and role assignment.
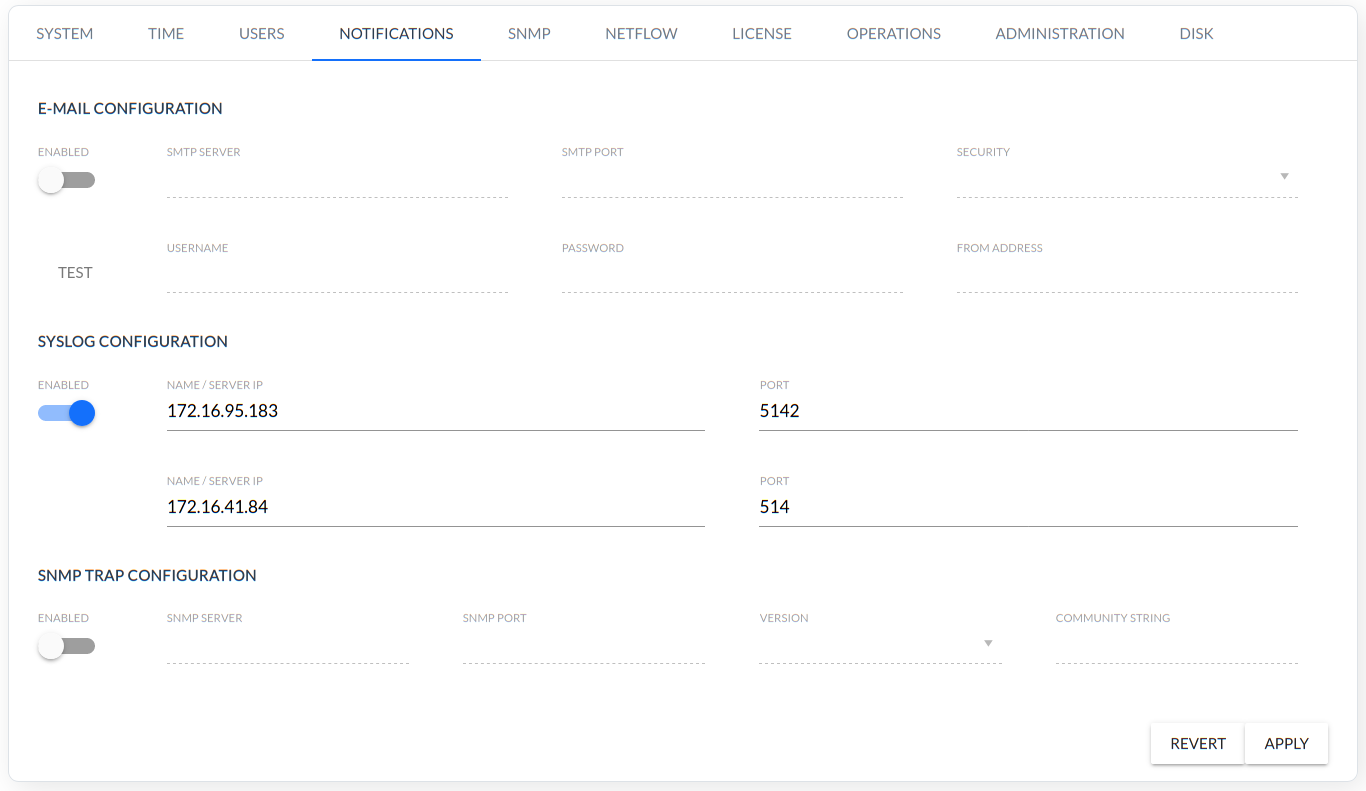
NOTIFICATION
Email, Syslog and SNMP trap configuration.
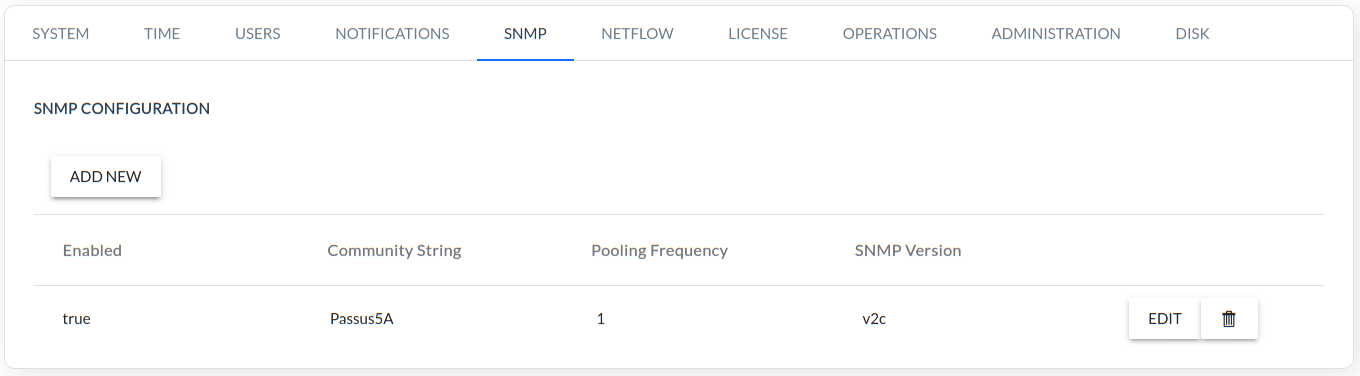
SNMP
SNMP pooling configuration (supported options v1/v2c/v3).
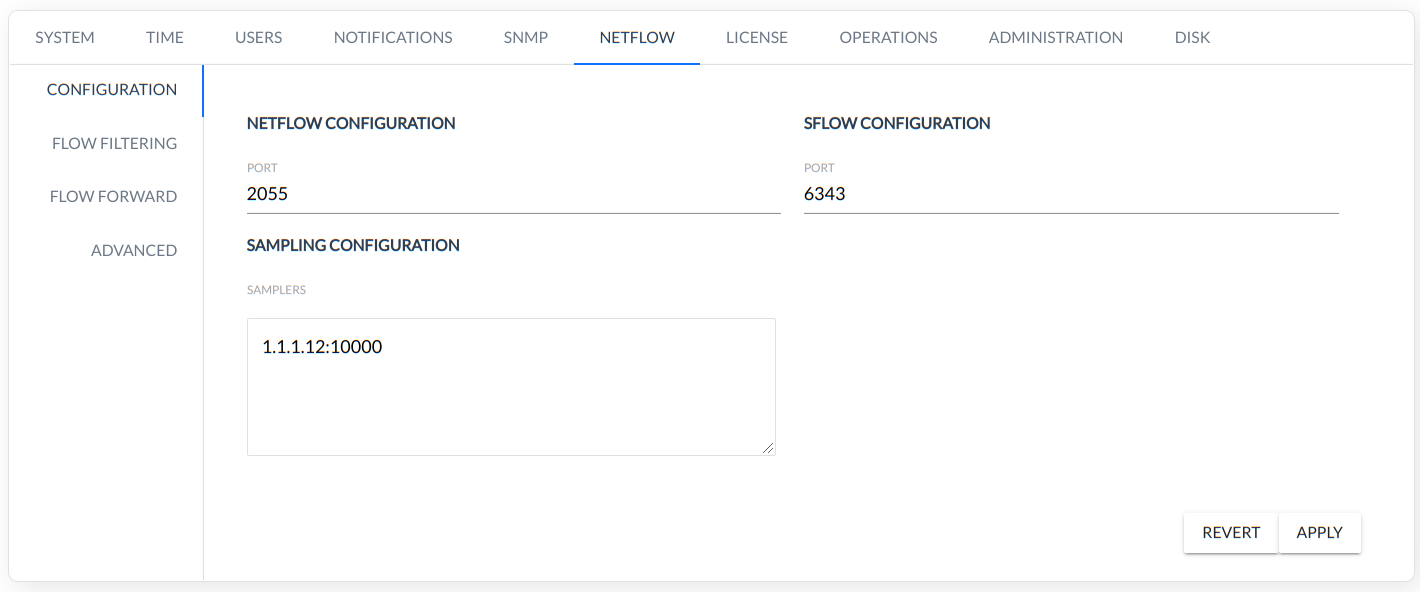
NETFLOW
Configuration of NetFlow, sFlow, IPFIX, NSEL parameters.
- CONFIGURATION
- NETFLOW CONFIGURATION - port to receive NetFlow packets
- SFLOW CONFIGURATION - port to receive NetFlow packets
- SAMPLING CONFIGURATION - NetFlow sampling rate
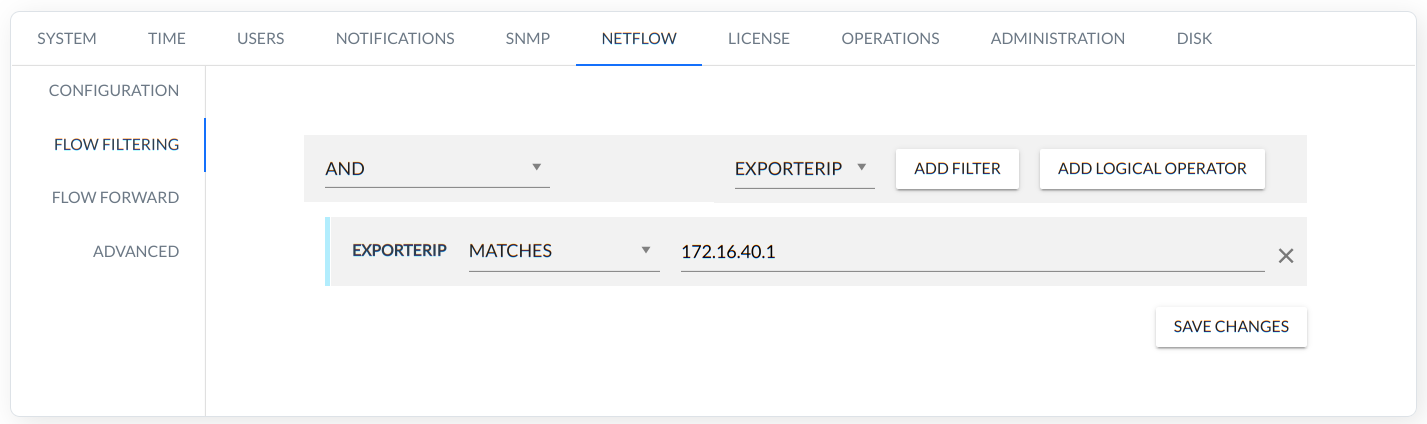
FLOW FILTERING
FlowControl allows the user to create rules to limit the data collected by the system to the collection that the user needs. Using this option saves disk space and system resources as well as helps to analyze data by operating only filtered data – which are critical to the user.
The system has a very flexible mechanism for creating rules. Individual rows of rules can be nested and combined using operators, depending on the user's needs and creating complex/expanded expressions.
When creating a filter rule, the user can use the following parameters/fields, each of which has its own set of operators.
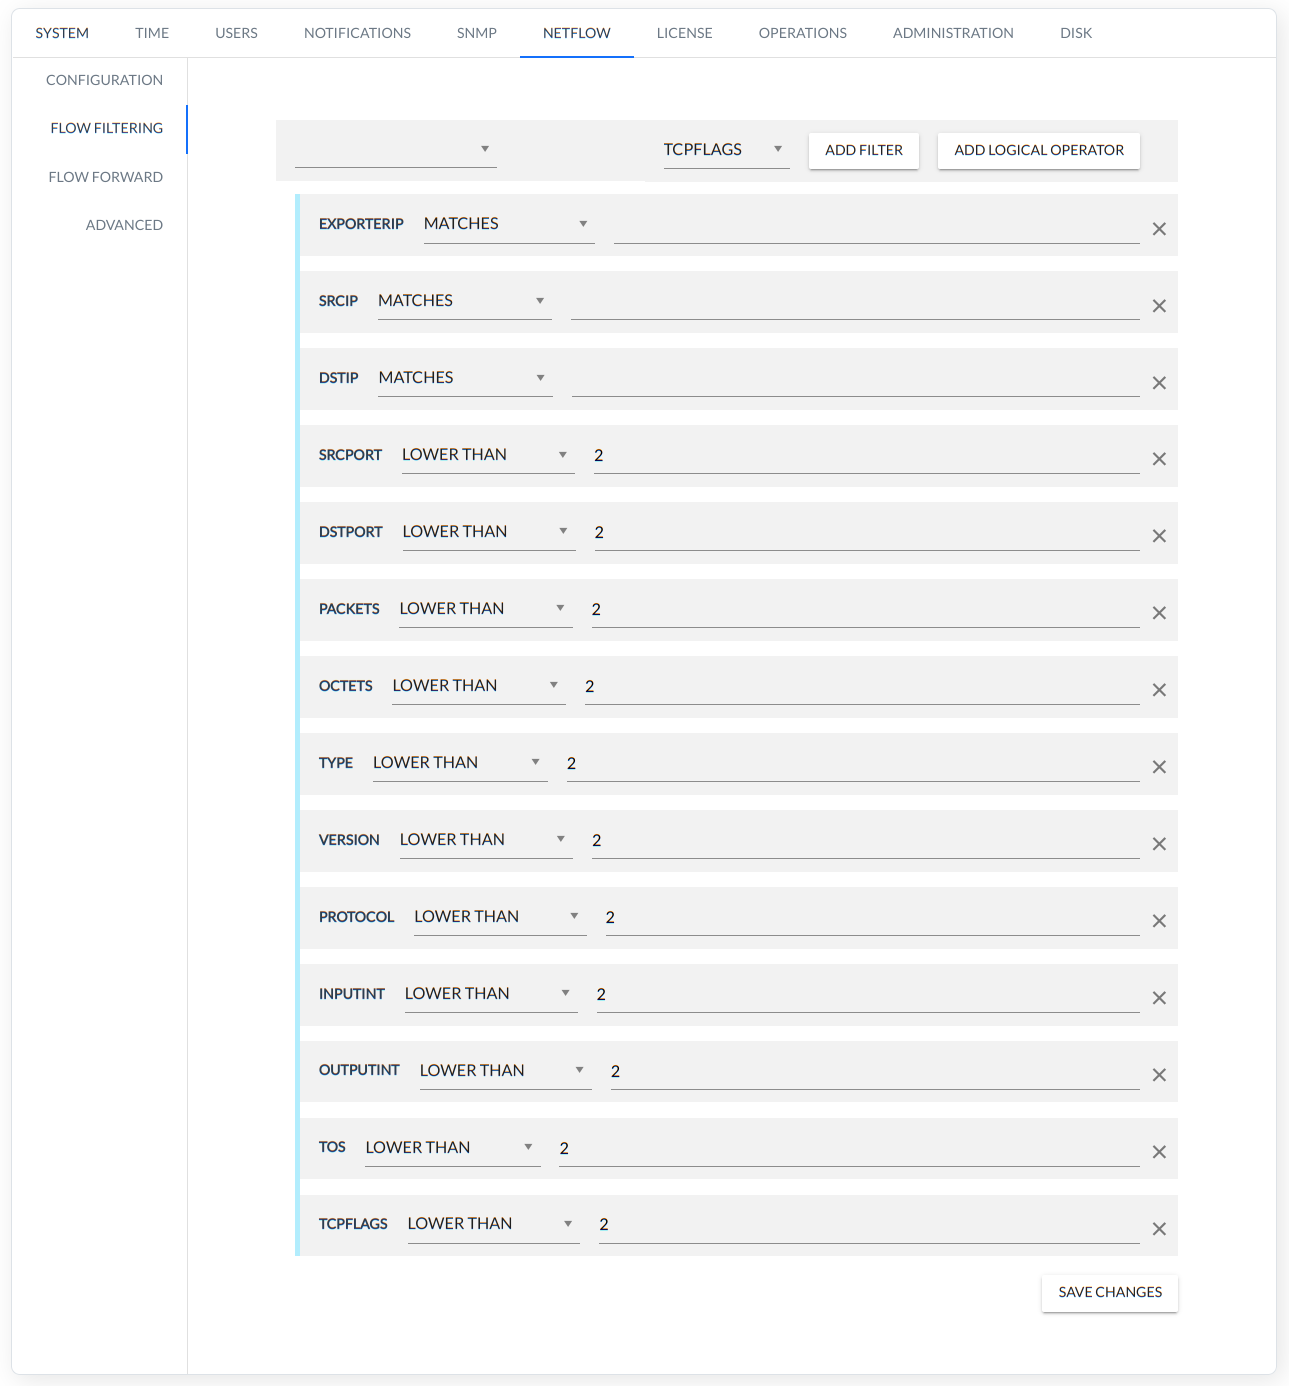
The following is a list of fields/parameters with their own operators.
| Parameter/Field | Operator |
|---|---|
| exporterIp | matches contains regexp is in subnet is in range is in |
| srcIp | matches contains regexp is in subnet is in range is in |
| dstIp | matches contains regexp is in subnet is in range is in |
| srcPort | lower than lower or equal than greater than greater or equal than equals not equals is in |
| dstPort | lower than lower or equal than greater than greater or equal than equals not equals is in |
| packets | lower than lower or equal than greater than greater or equal than equals not equals is in |
| octets | lower than lower or equal than greater than greater or equal than equals not equals is in |
| type | lower than lower or equal than greater than greater or equal than equals not equals is in |
| version | lower than lower or equal than greater than greater or equal than equals not equals is in |
| protocol | lower than lower or equal than greater than greater or equal than equals not equals is in |
| input | lower than lower or equal than greater than greater or equal than equals not equals is in |
| output | lower than lower or equal than greater than greater or equal than equals not equals is in |
| tos | lower than lower or equal than greater than greater or equal than equals not equals is in |
| tcpFlags | lower than lower or equal than greater than greater or equal than equals not equals is in |
Relationships between rows can be specified using the three operators AND, OR, and NOT (ADD LOGICAL OPERATOR).
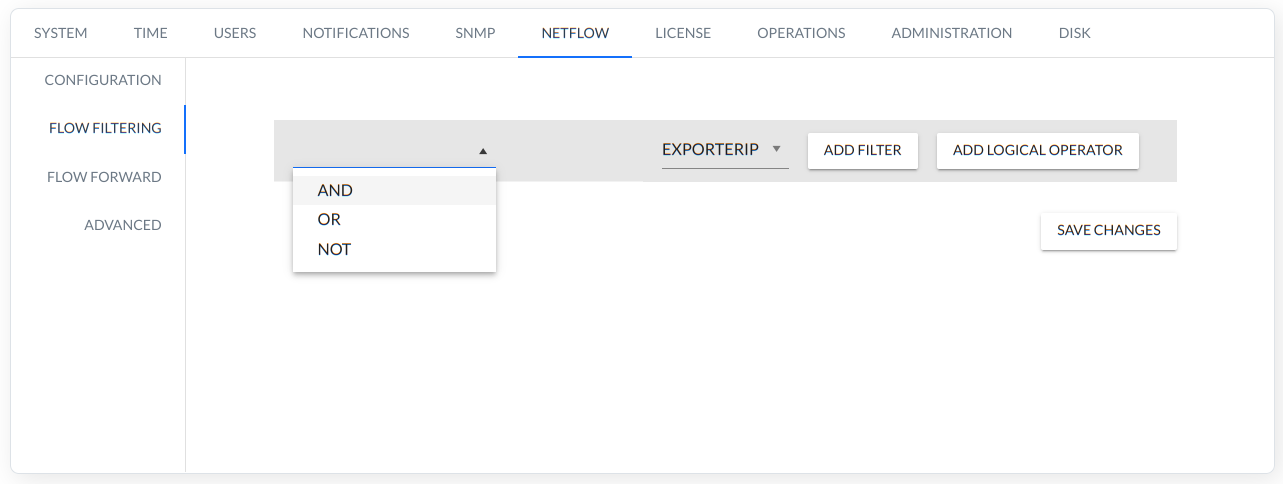
It is possible to move the rows and swap positions by clicking and holding the left mouse button on the left side of the row.
By adding more filters and logical operator users can create complex filter expressions ( done similarly to the alert wizard).
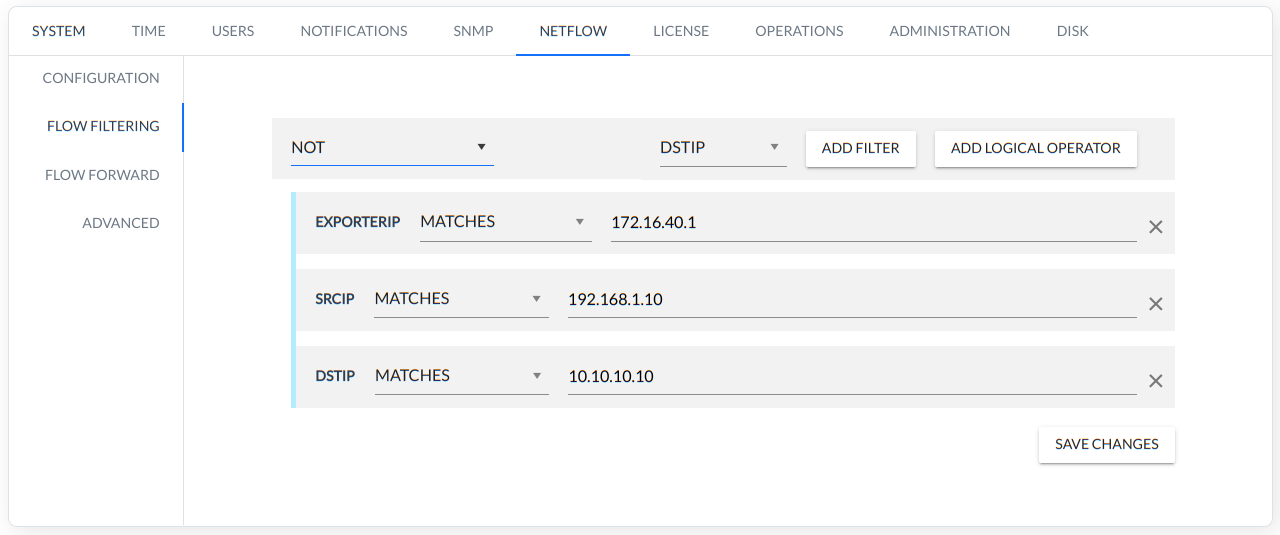
Example filter rule:
FlowFilter rule = (EXPORTERIP MATCHES 172.16.40.1) NOT (SRCIP MATCHES 192.168.1.10) NOT (DSTIP MATCHES 10.10.10.10)
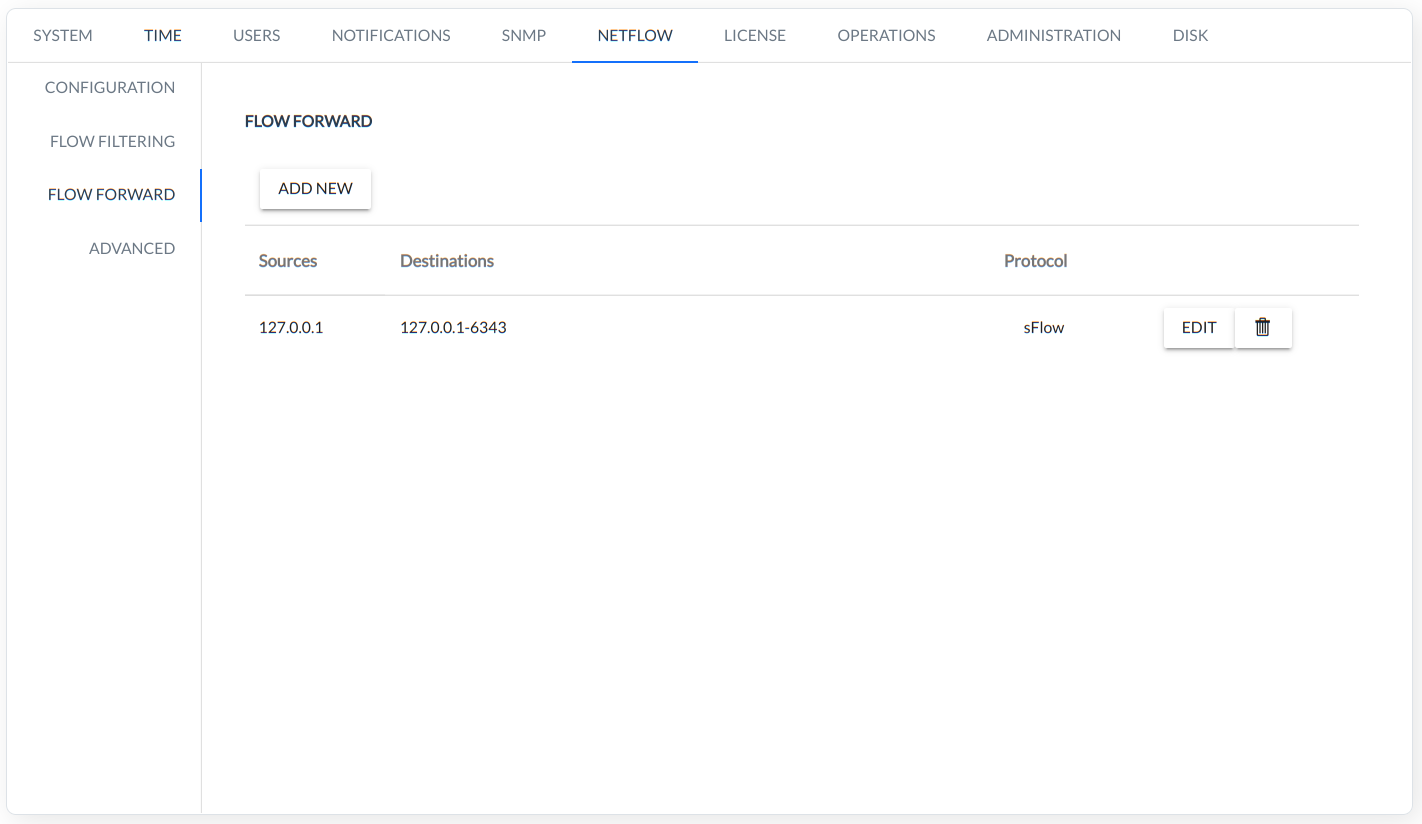
- FLOW FORWARD - allows the NETFLOW stream to be forwarded to additional user-defined devices.
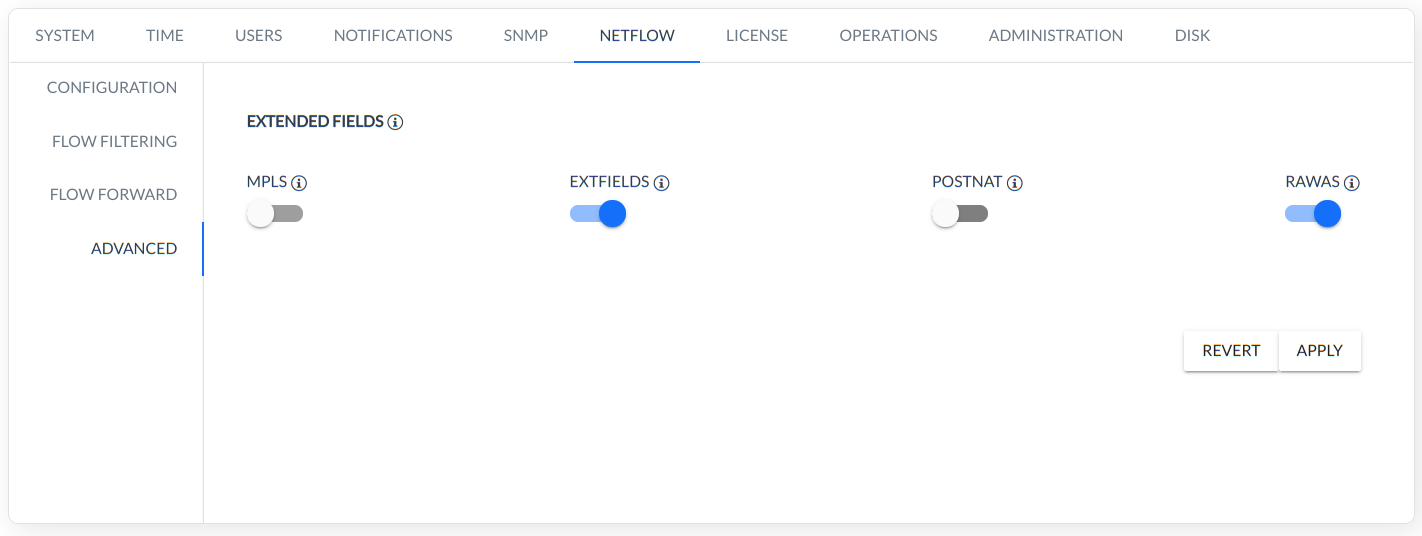
ADVANCED
This menu allows configure the handling of additional fields in NetFlow and IPFIX. All additional fields are available only in the RawData menu.
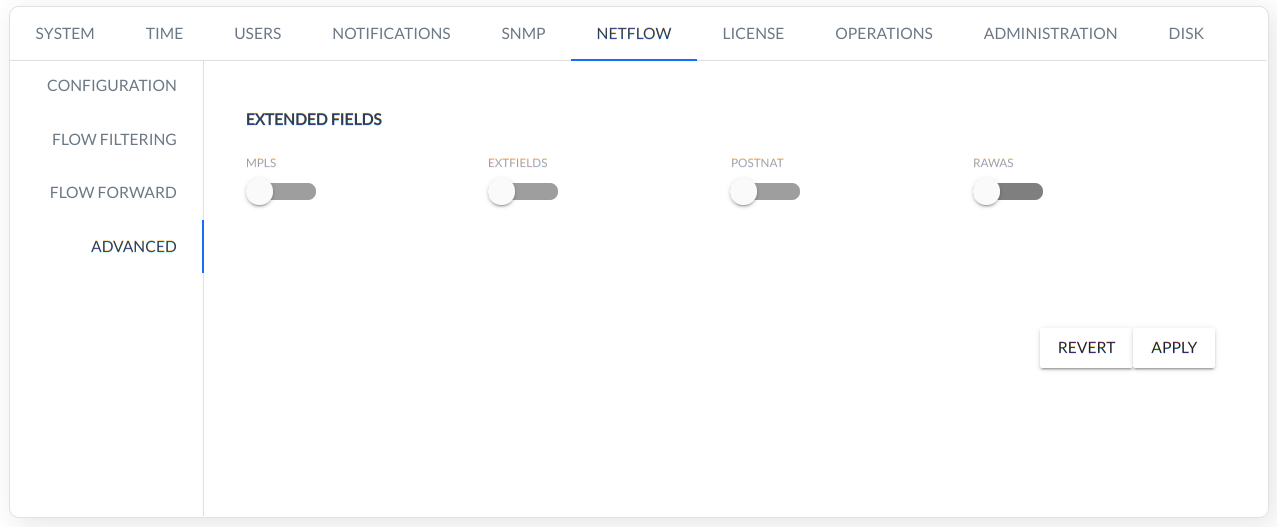
The fields are divided into the following four group:
MPLS,
EXTFIELD,
POSTNAT,
RAWS.
NOTE: The system-supported additional/extended fields must be configured on devices that have the ability to transmit these data using NETFLOW, IPFIX.
The MPLS group consists of the following additional fields:
"MPLS Top Label Exp"
"MPLS Label 1"
"MPLS Label 2"
"MPLS Label 3"
"MPLS Label 4"
"MPLS Label 5"
The EXTFIELD group consists of the following additional fields:
"Min Packet Length"
"Max Packet Length"
"Flow Label"
"IPv6 Option Header"
The POSTNAT group consists of the following additional fields:
"NAT Source IP"
"NAT Source Port"
The RAWS group consists of the following additional fields:
"Raw Source Host AS Name"
"Raw Destination Host AS Name"
"Raw Source Host AS Number"
"Raw Destination Host AS Number"
The FC system can handle each of the above groups independantly by moving the corresponding switch in the menu NETFLOW-ADVANCED to on (blue).
NOTICE: The above fields are handled from the 1.6 version of the FlowControl system. In order to analyze the historical data collected in previous versions of the system, the handling of all additional fields in the NETFLOW-ADVANCED must be disabled.
LICENSE
License management.
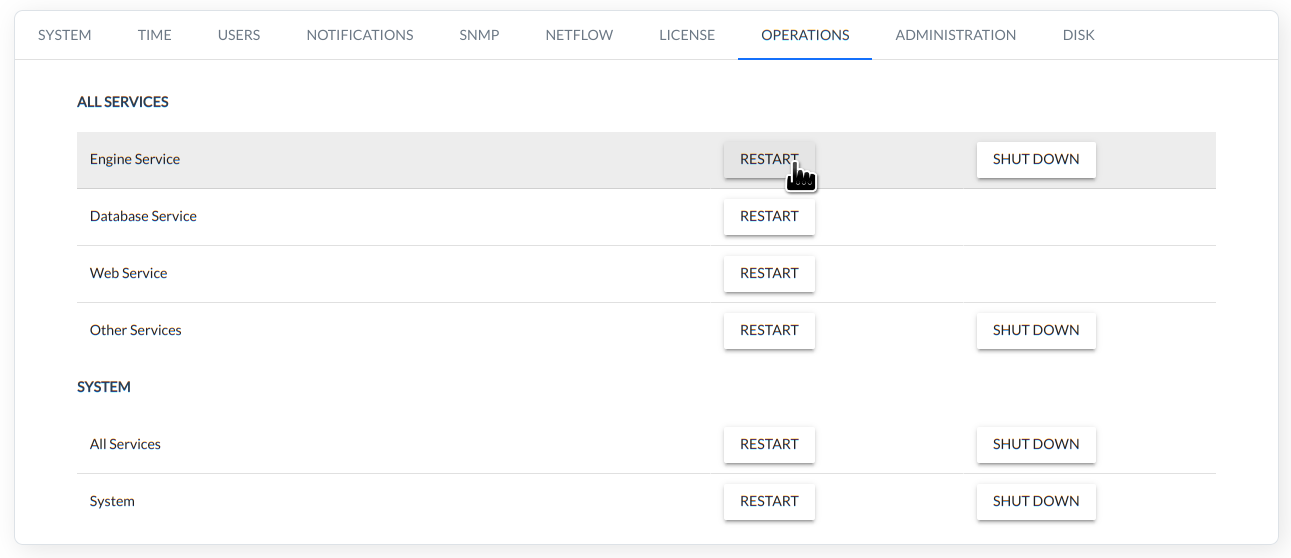
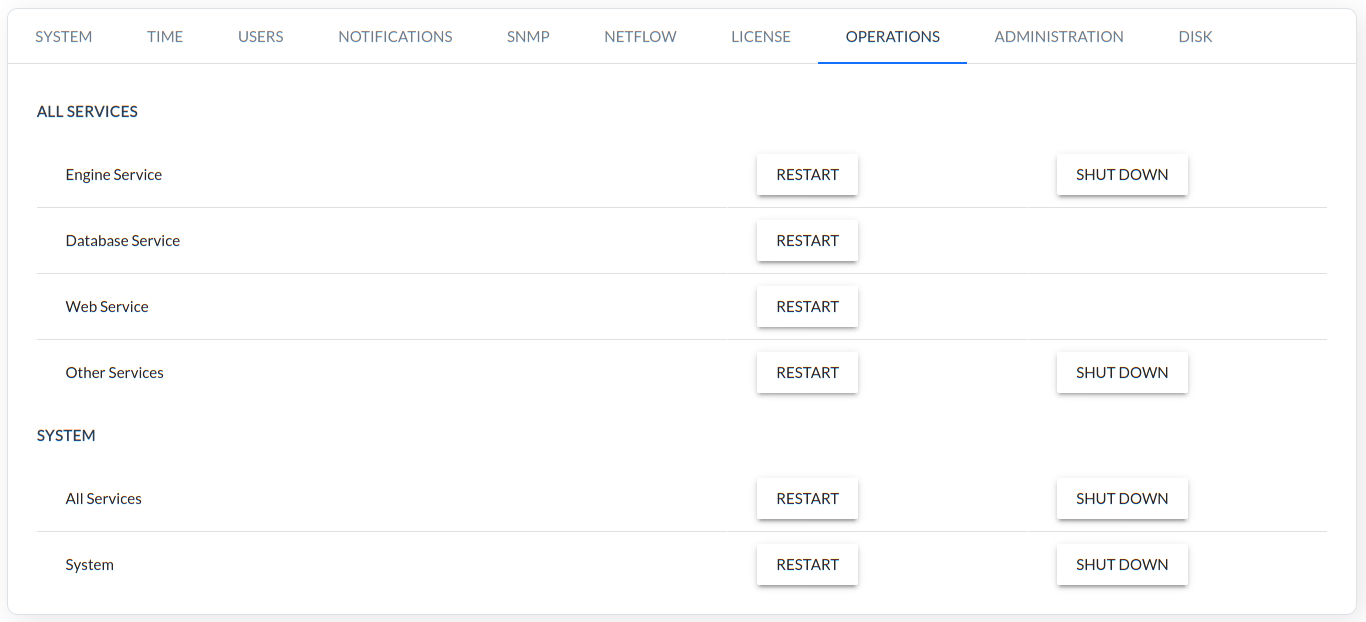
OPERATIONS
Application and system restart/shutdown options.
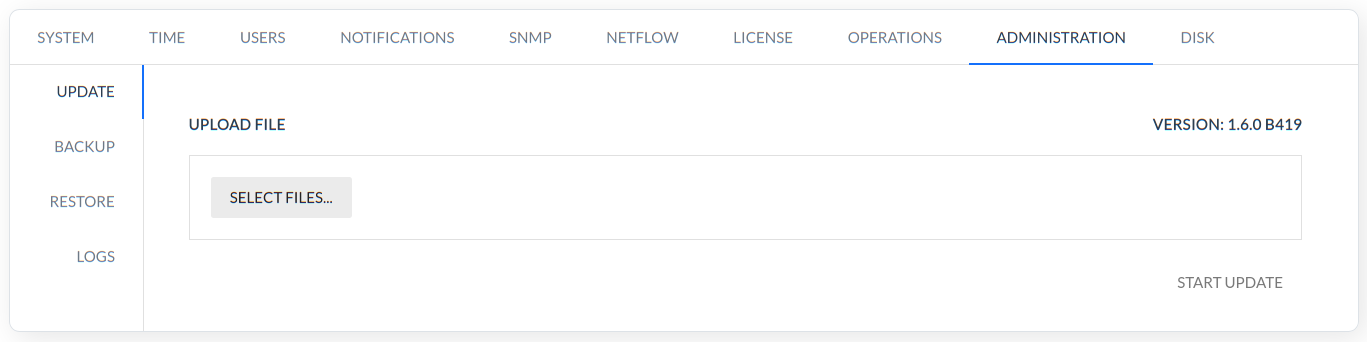
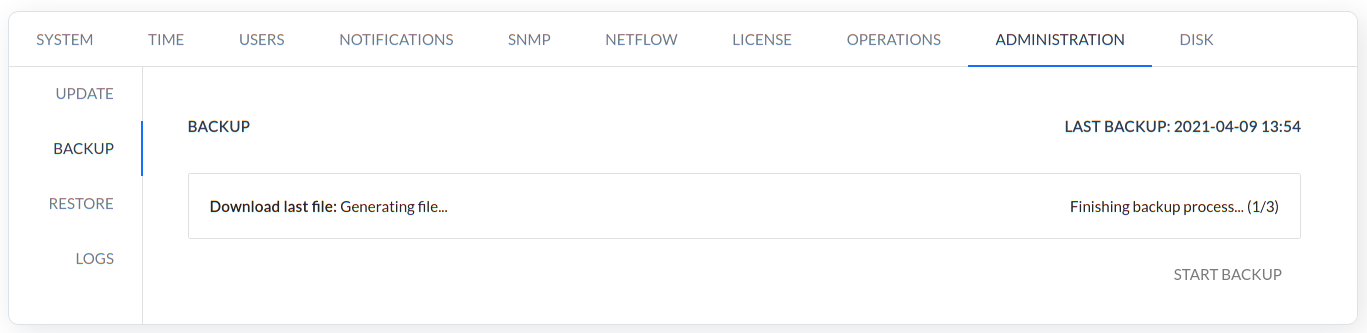
ADMINISTRATION
System utilities such as update, backup, restore, logs.
There are 4 processes: Update, Backup, Restore, and Logs. All processes are dependant. Only one process can be completed at a time and if one process executes it blocks the others. In case, the system support expires, these processes will be blocked.
When the process started, its status appears in the pane and after the browser has been refreshed during the process, a status popup is appear
ADMINISTRATION
UPDATE - This command is used to make an update to the latest version of the system.
BACKUP - This command is used to generate backup.
RESTORE - This command is used to restore the backup.
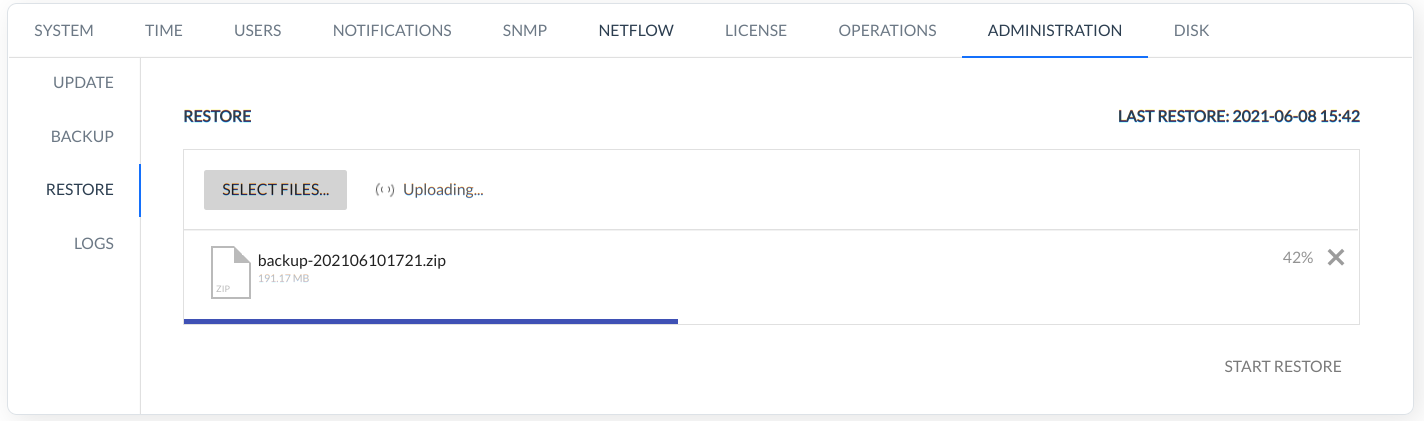
After uploading the backup file, a list of elements that can be restored appears.
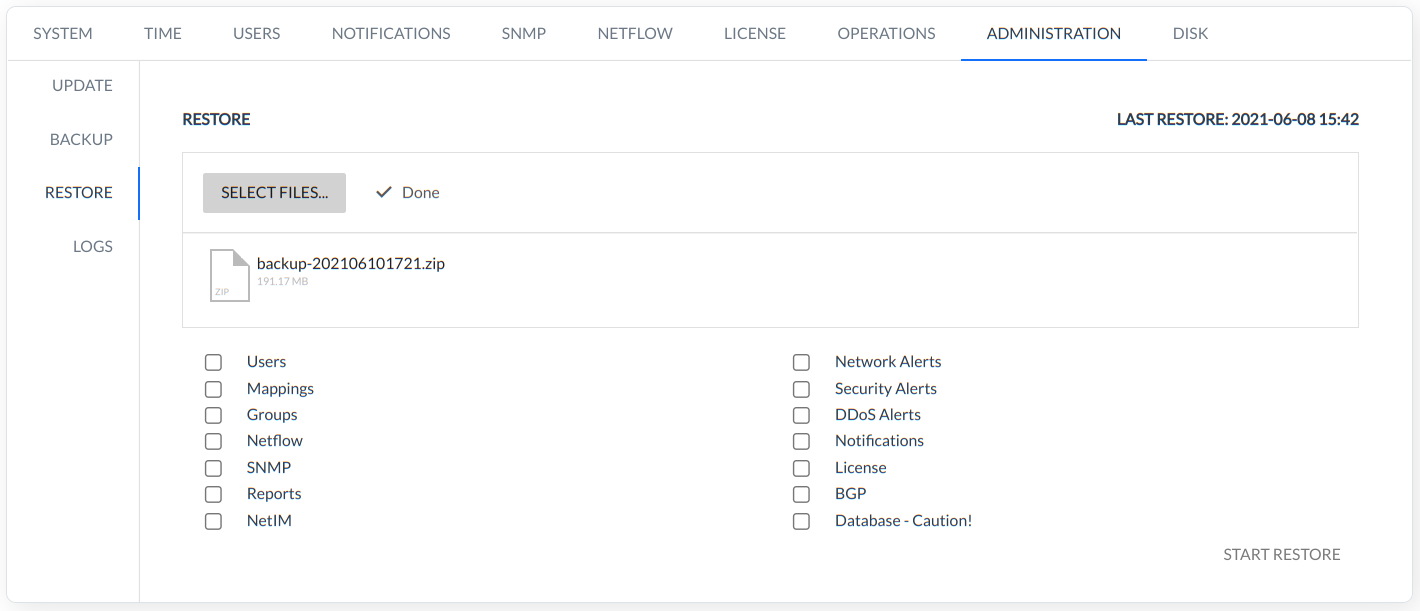
Backup restore command also restores views, dashboards and bookmarks.
LOGS - This command is used to generate logs.
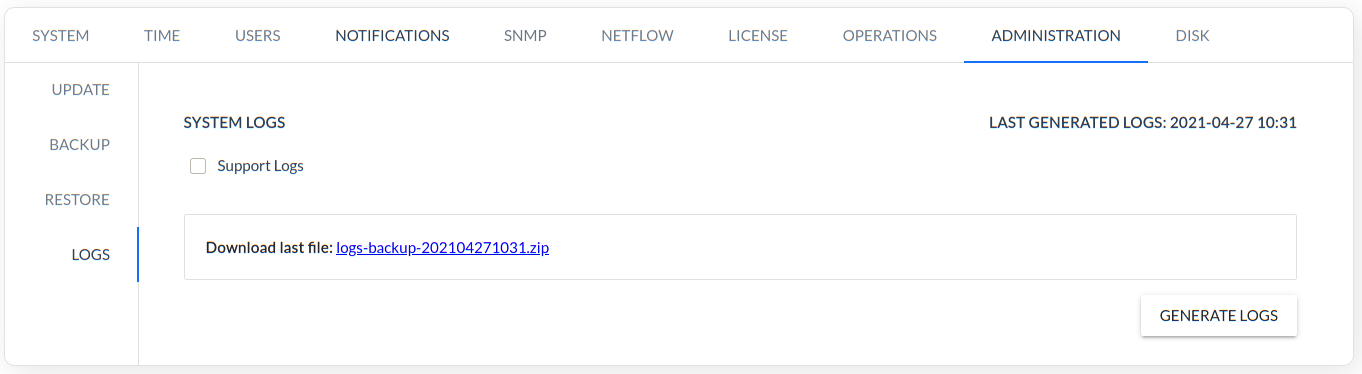 Two types of log collections can be generated: Basic and Support Logs. Basic type log is saved to a regular ZIP file used for basic diagnosis like: checking the execution of the backup, restore, logs, update commands or checking the logs engine. A file with the collected logs is available for download through the GUI as shown in the figure above.
Support Logs option is used to generate logs for support team.
DISK
DISK-CAPACITY - This command is used to handle the length of time the data is stored in the system depends on granulation and the type of database.
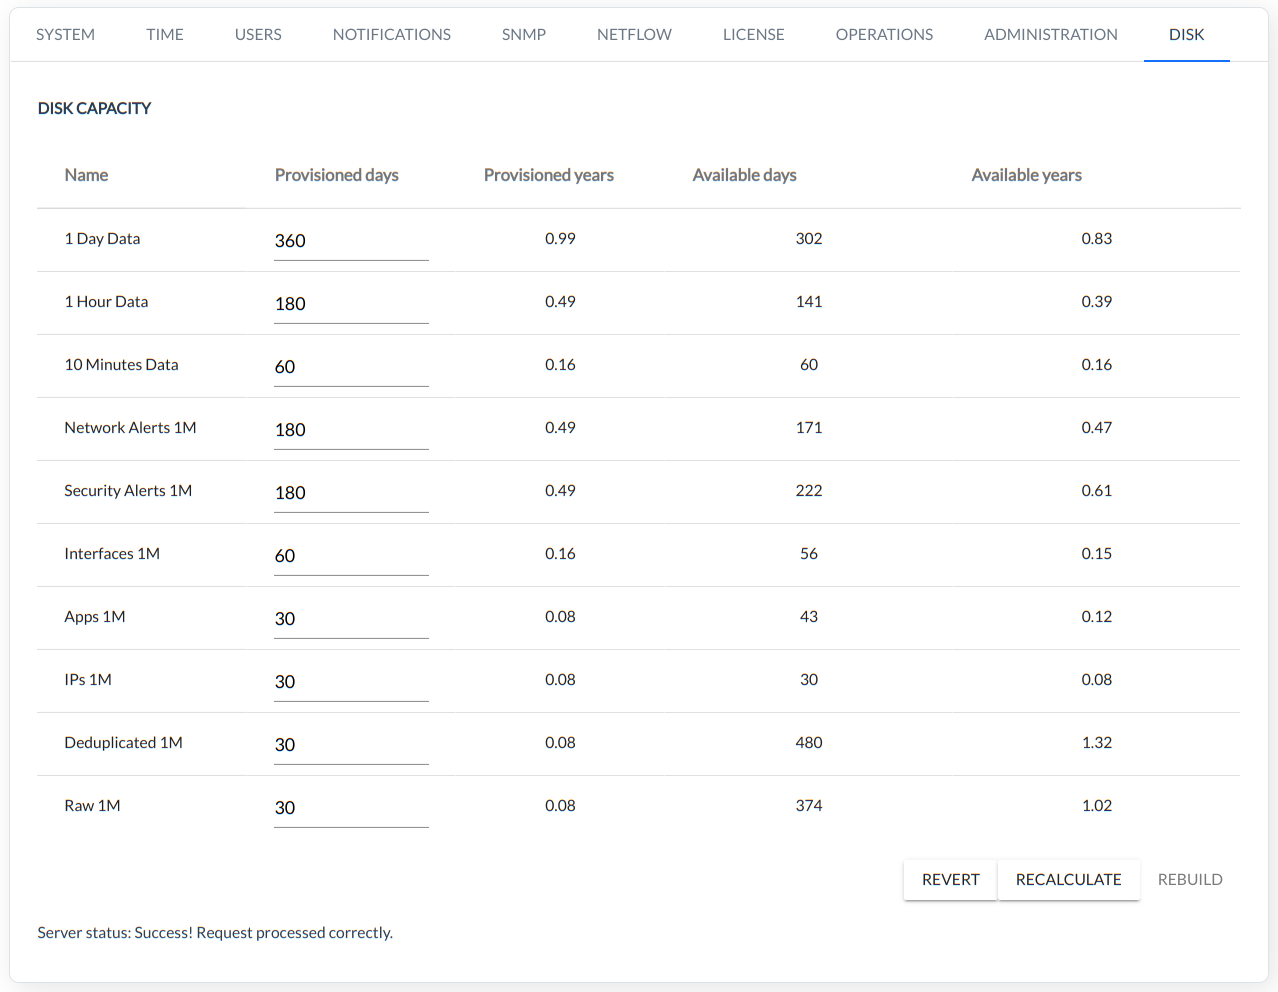
The table below lists the parameters in the DISK CAPACITY window with their descriptions.
| Name | Description |
|---|---|
| 1 Day Data | All databases with 1-day granularity |
| 1 Hour Data | All databases with 1-hour granularity |
| 10 Minutes Data | All databases with 10-minutes granularity |
| Network Alerts 1M | XN module network alarms |
| Security Alerts 1M | XNS module security alarms |
| DDoS Alerts 1M | XND module DDoS alarms |
| Interfaces 1M | Interface database with 1-minute granulation. |
| Apps 1M | Application database with 1-minute granulation. |
| IPs 1M | IP data base with 1-minute granularity. |
| Deduplicated 1M | De-duplicated database with 1-minute granulation |
| Raw 1M | RAW Flows database with 1-minute granularity |
DDoS
This is DDOS attack detection based on behavioral and statistical analysis witch mitigation attack module.
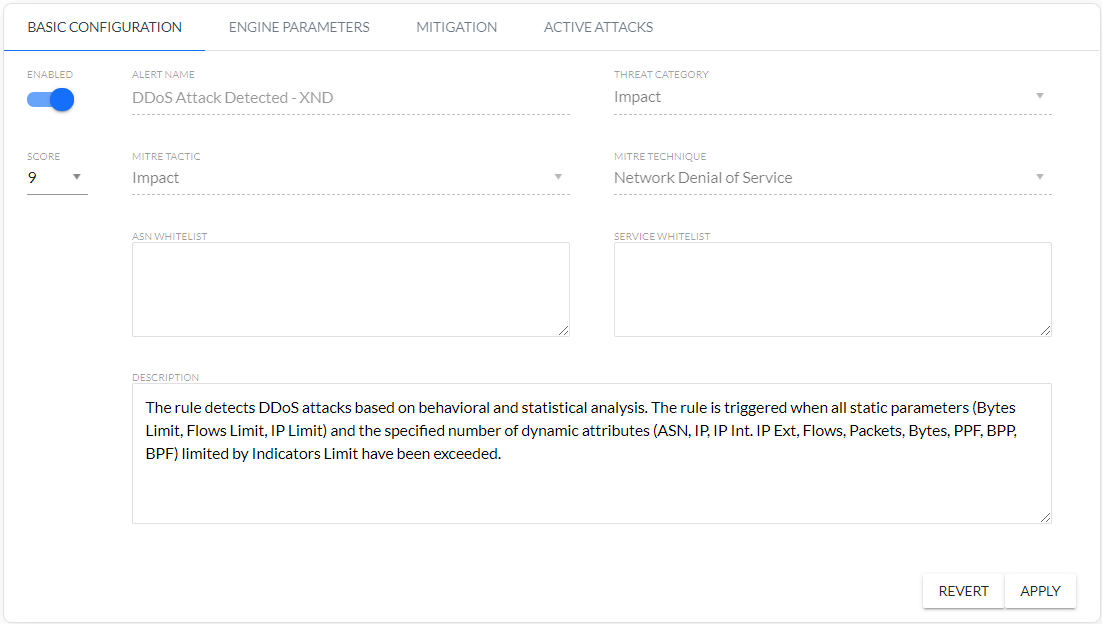
- BASIC CONFIGURATION.
- ENGINE PARAMETERS.
- FLOWSPEC BGP.
- ACTIVE ATTACKS.
XND module full description can be found in the documentation XND User Guide https://documentation.sycope.com/XND
Security
In the Security section the system allows users to review and manage security rules created according to the MITRE ATT&CK methodology.
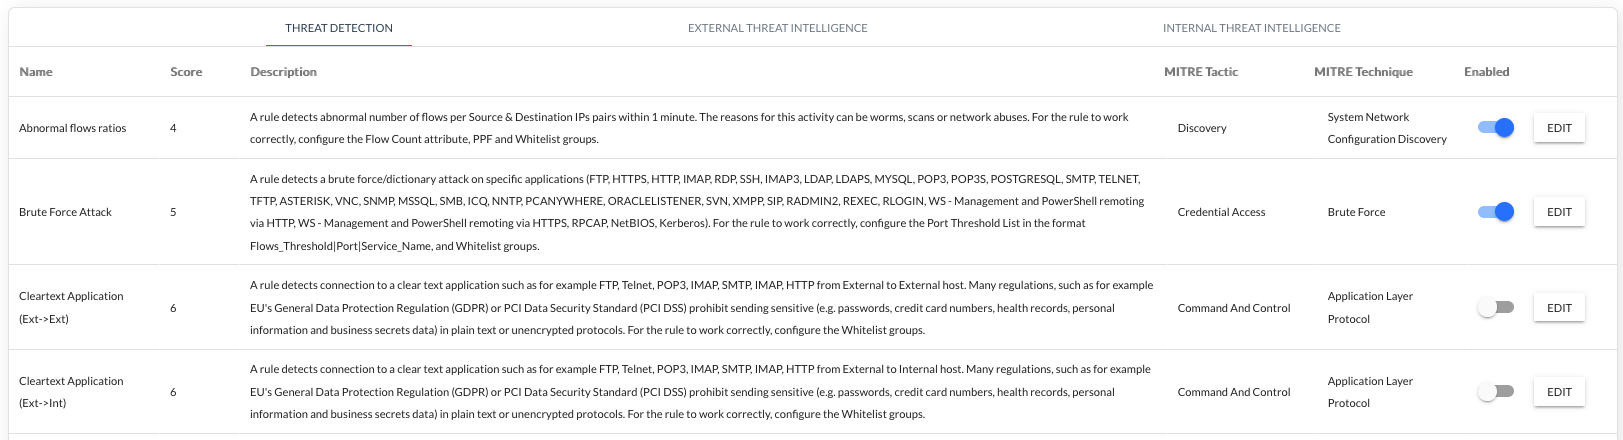
Configuration of the security ruleset is based on three sections:
- THREAT DETECTION - Identification of different threat patterns based on proprietary Sycope created rules (this section allows rule set modification but no rule adding).
EXTERNAL THREAT INTELLIGENCE - Identification of different threat patterns utilizing several external threat feeds (this section allows rule set modification but no rule adding).
The system retrieves the feeds from the external sources at intervals of hour.
INTERNAL THREAT INTELLIGENCE - Identification of the custom threat patterns configured by users.
XNS module full description can be found in the documentation XNS User Guide https://documentation.sycope.com/XNS
Mapping
The system allows mapping between internal networks into a more comprehensive convention which is then used in data presentation. There are six main sections of the mapping configuration:
NAME - here is a possibility to assign names to the following data objects:
DEVICES - rule defines a name for the IP,
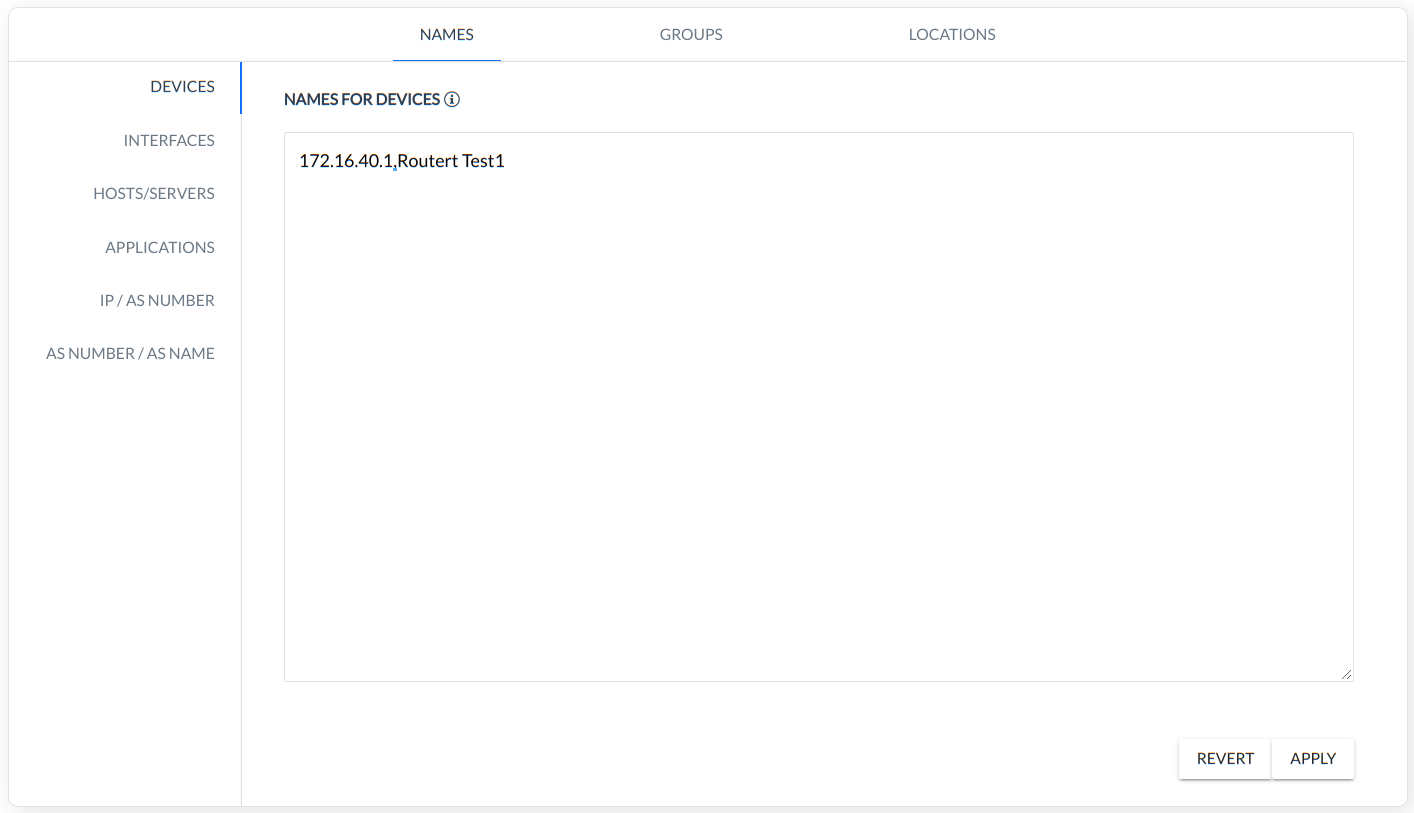
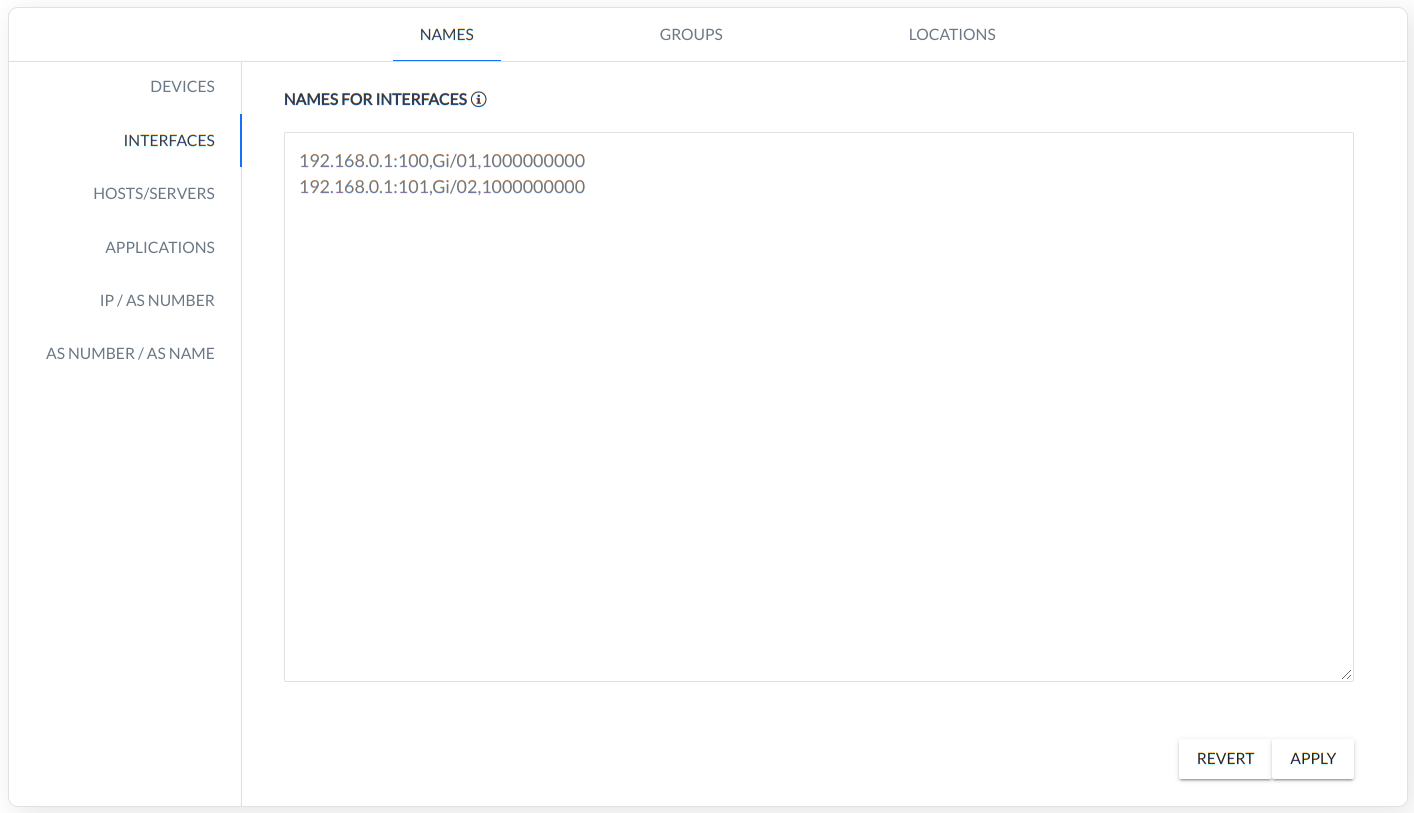
INTERFACES - rule defines several aspects of the Device Interface (Device IP: Interface ID,Interface Name/Description,Interface Speed),
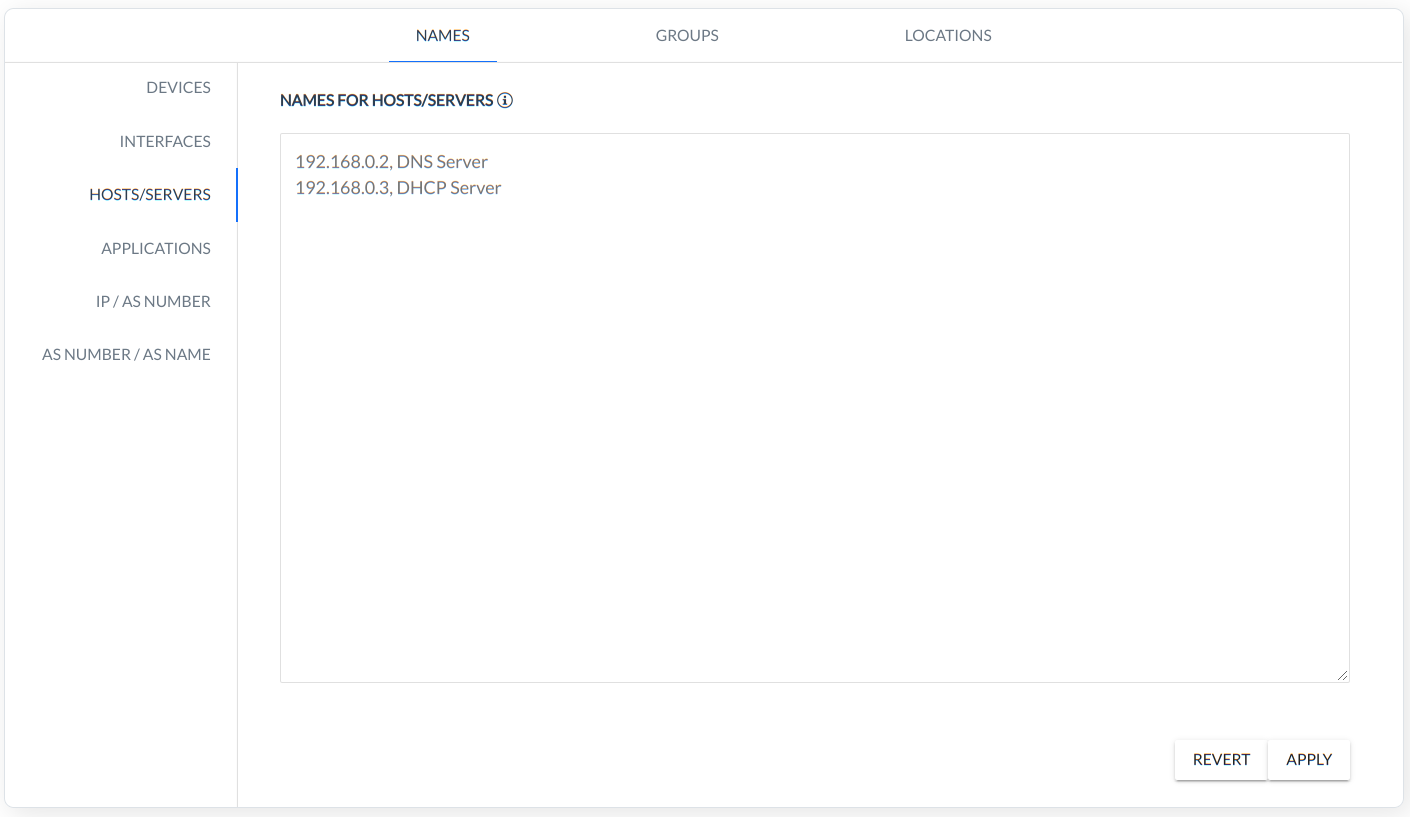
HOSTS/SERVERS - rule defines a name for the Server/HOST IP,
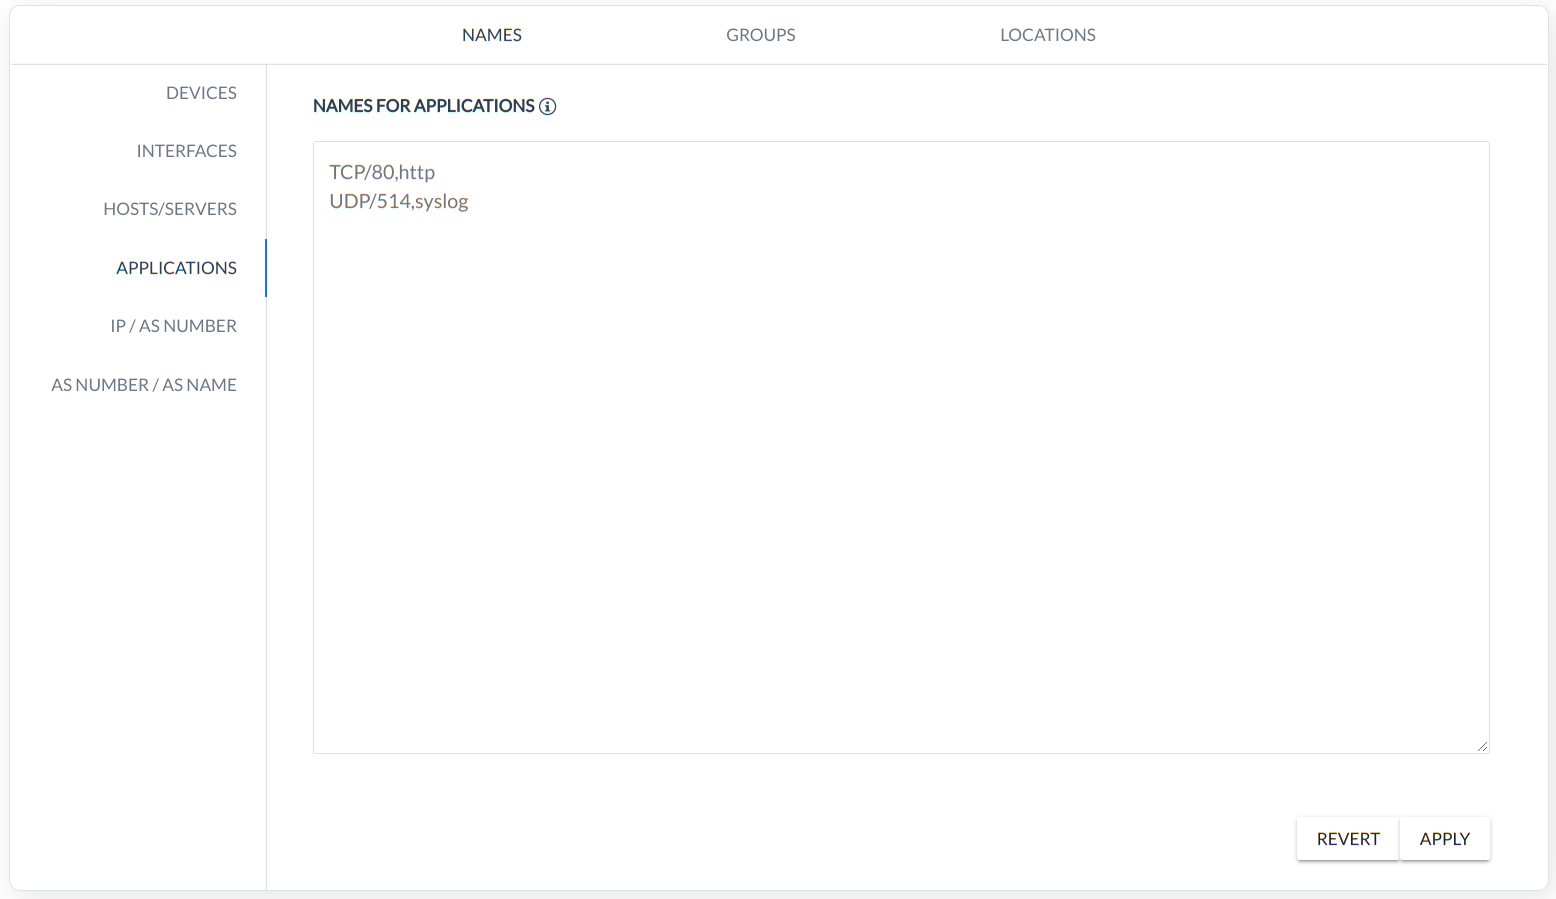
APPLICATIONS - rule defines a name for the custom APPLICATIONS (Protocol/Port Number,Name),
Note: Please remember that in case a NAME or any other parameter exists already and is predefined in the system ex. Application Definitions, mapping will override those values with the user defined ones.
For the system, the order of default applications is as follows:
- 80,HTTP,TCP
- 443,HTTPS,TCP
- 445,SMB,TCP
- 22,SSH,TCP
- 23,TELNET,TCP
- 25,SMTP,TCP
- 110,POP3,TCP
- 143,IMAP4,TCP
- 20,FTP,TCP
- 21,FTP,TCP
- 1194,OPENVPN,TCP
- 5432,PostgreSQL,TCP
If you set up your applications in Mappings, the applications will be displayed first, and then the default applications that did not match with the Mappings applications.
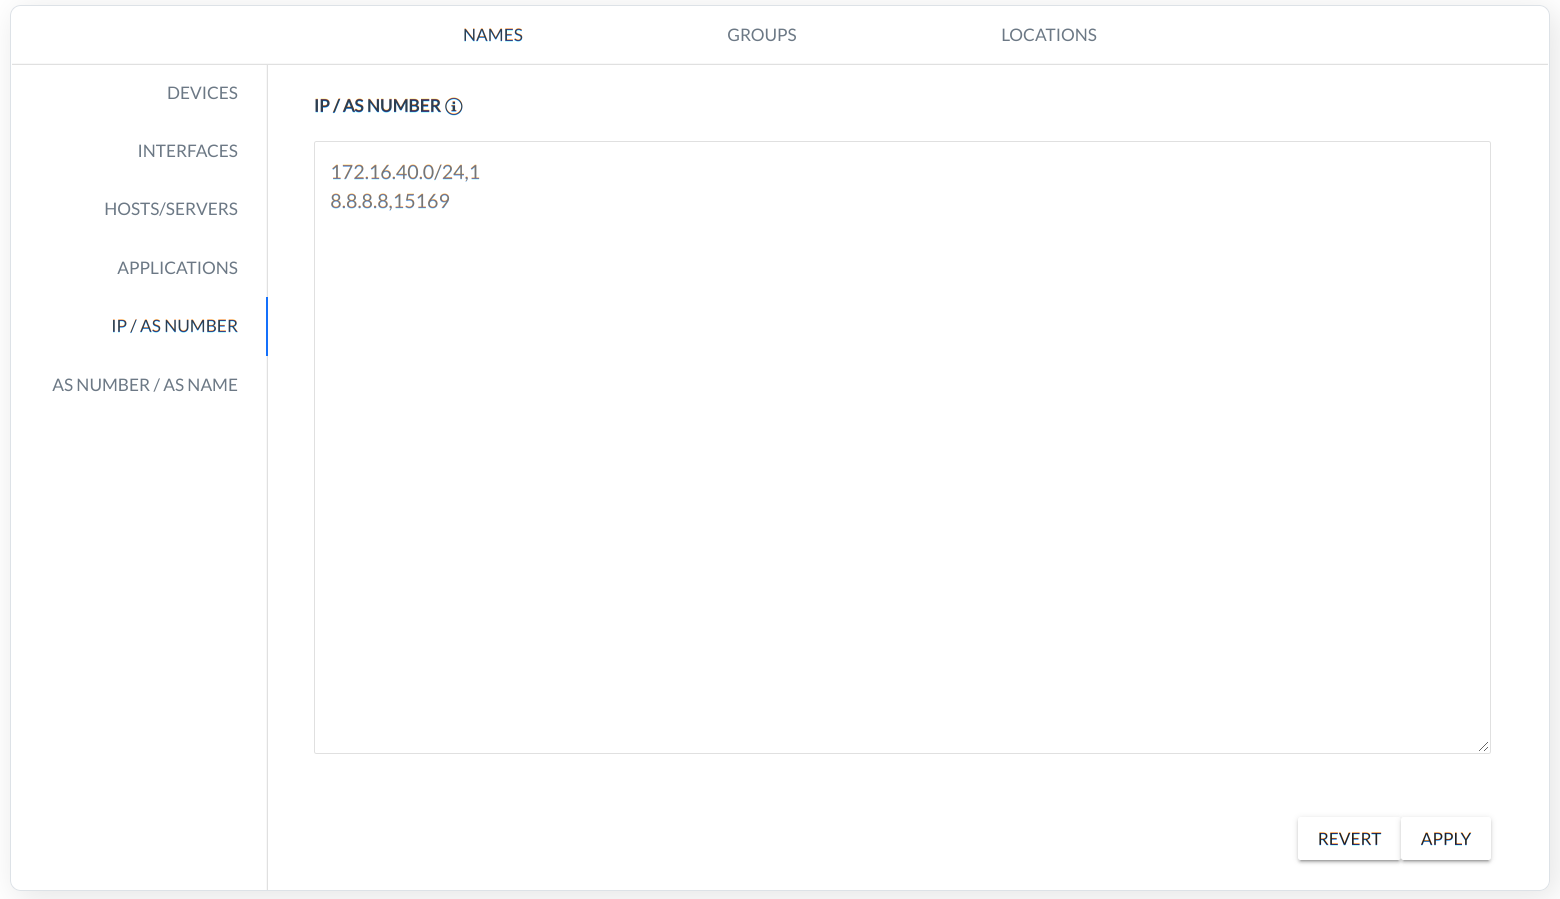
IP/AS NUMBER - rule defines ip address for the AS number.
AS NUMBER/AS NAME - rule defines the custom name for AS (Number, Name).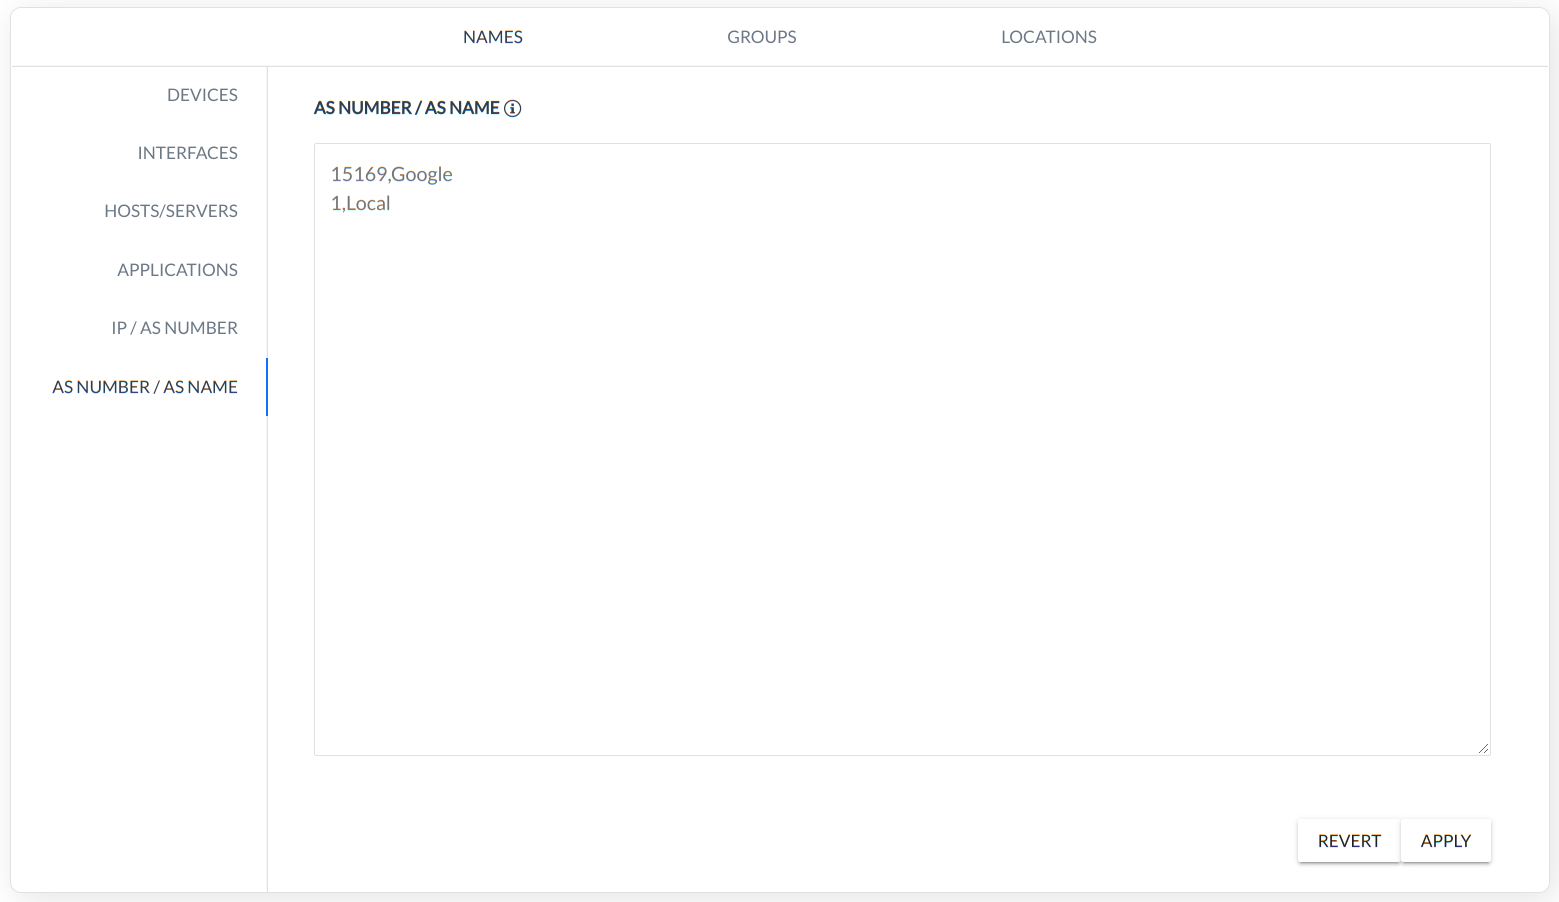
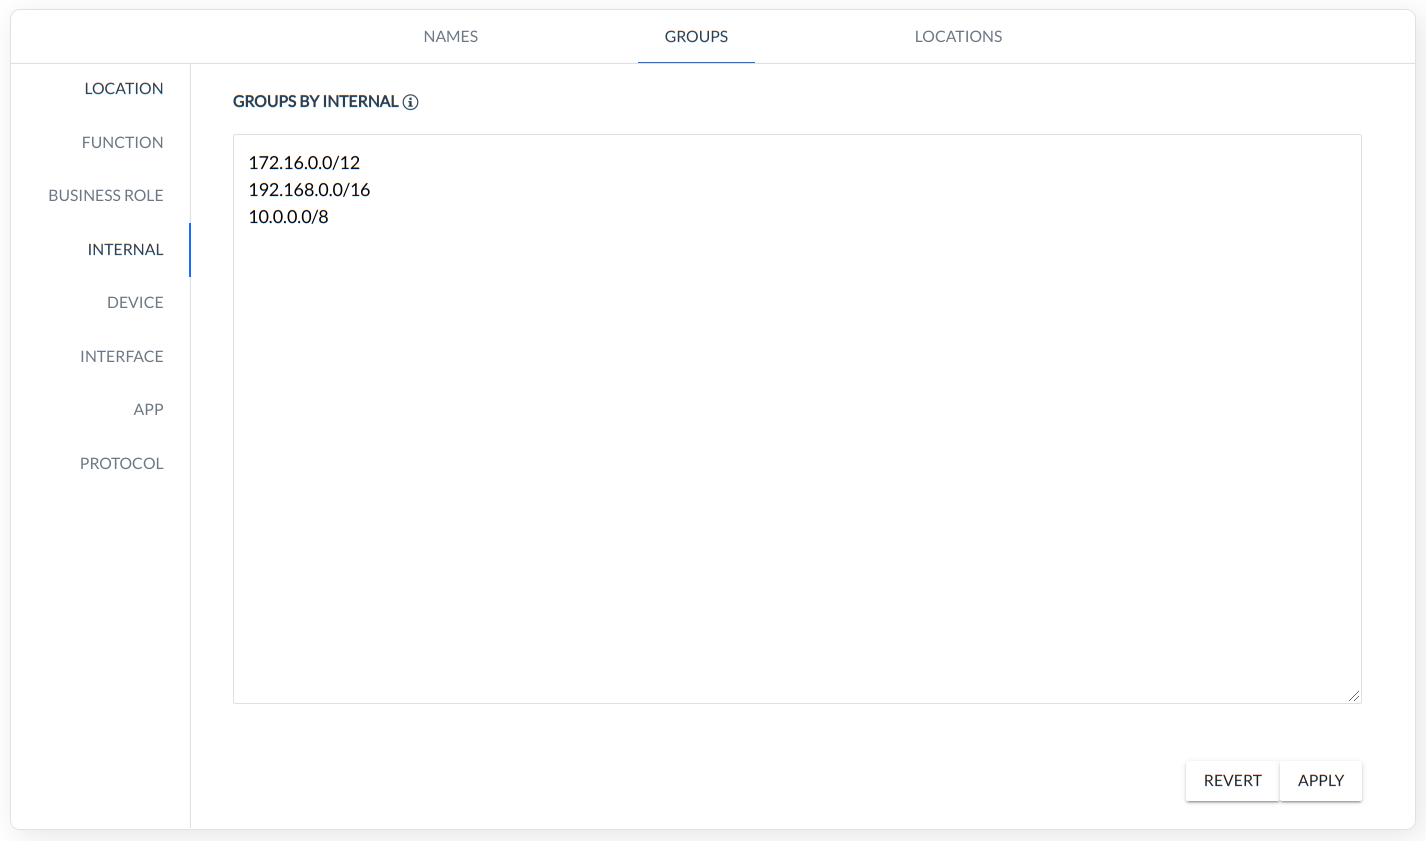
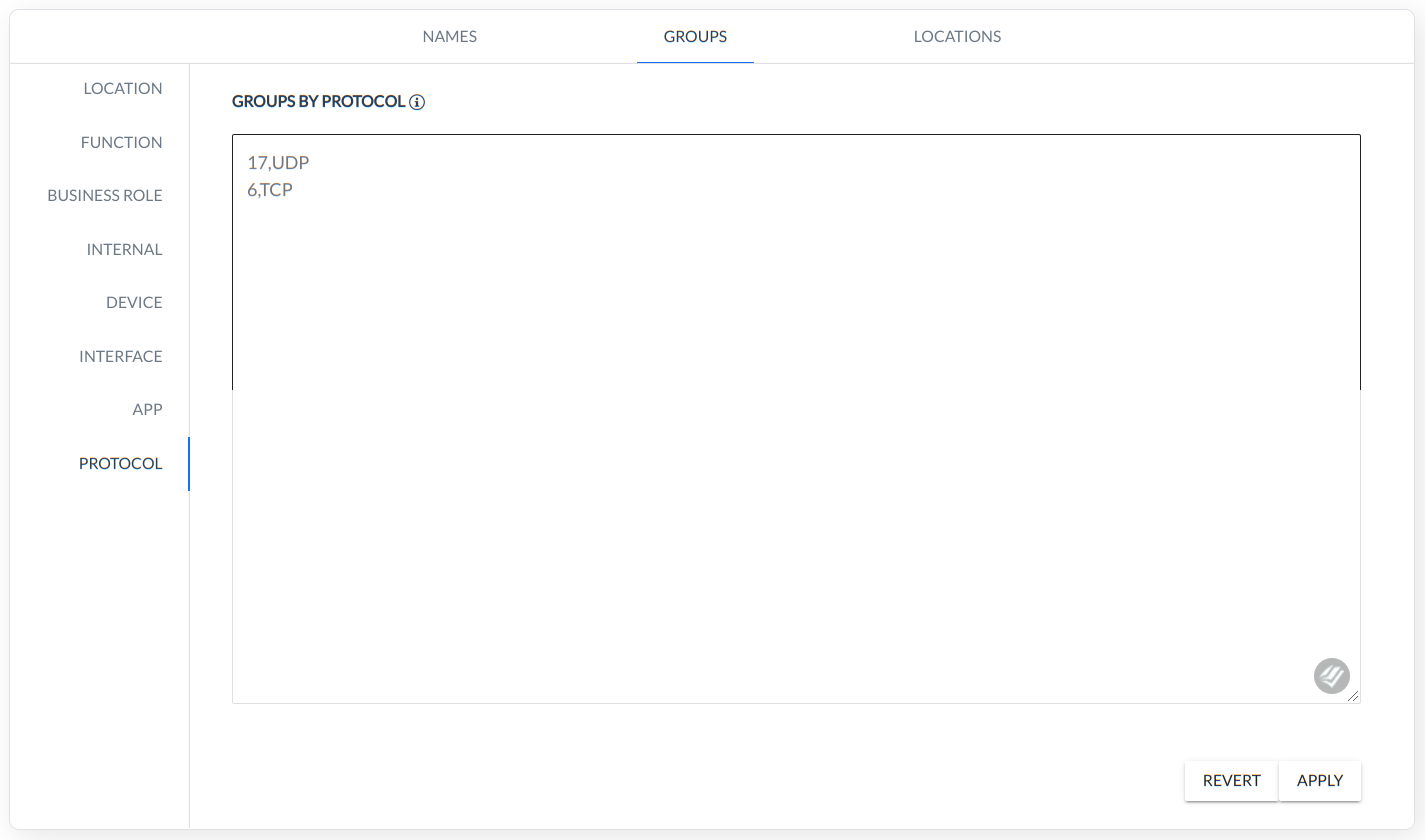
GROUPS - users can assign names to the internal networks utilizing eight grouping sets :
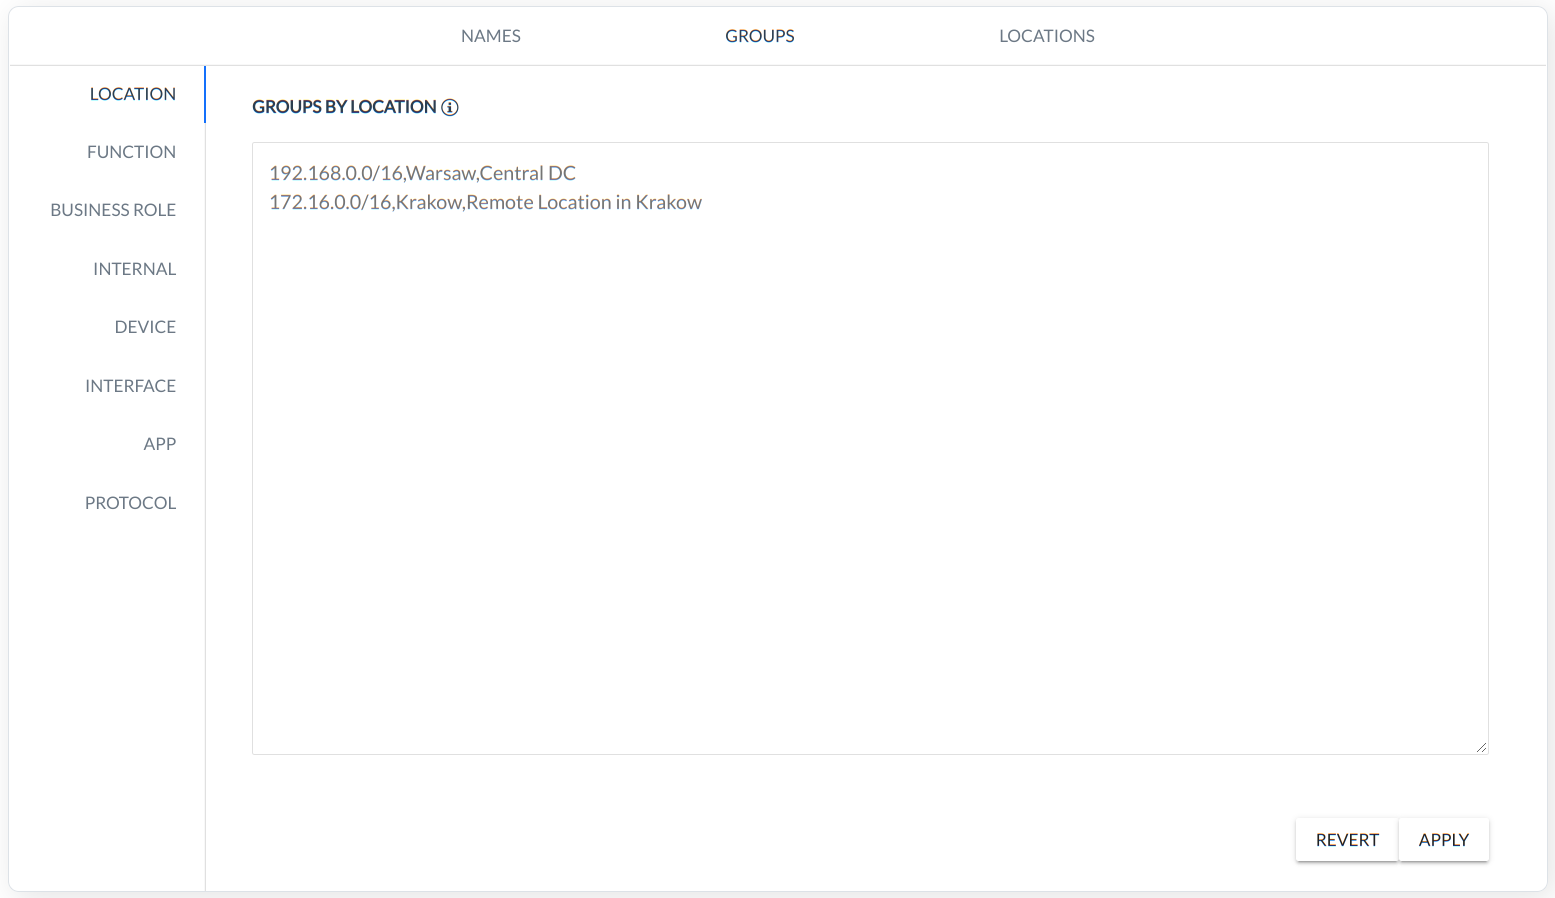
LOCATION - grouping based on NETWORK location (CIDR, Name, Description),
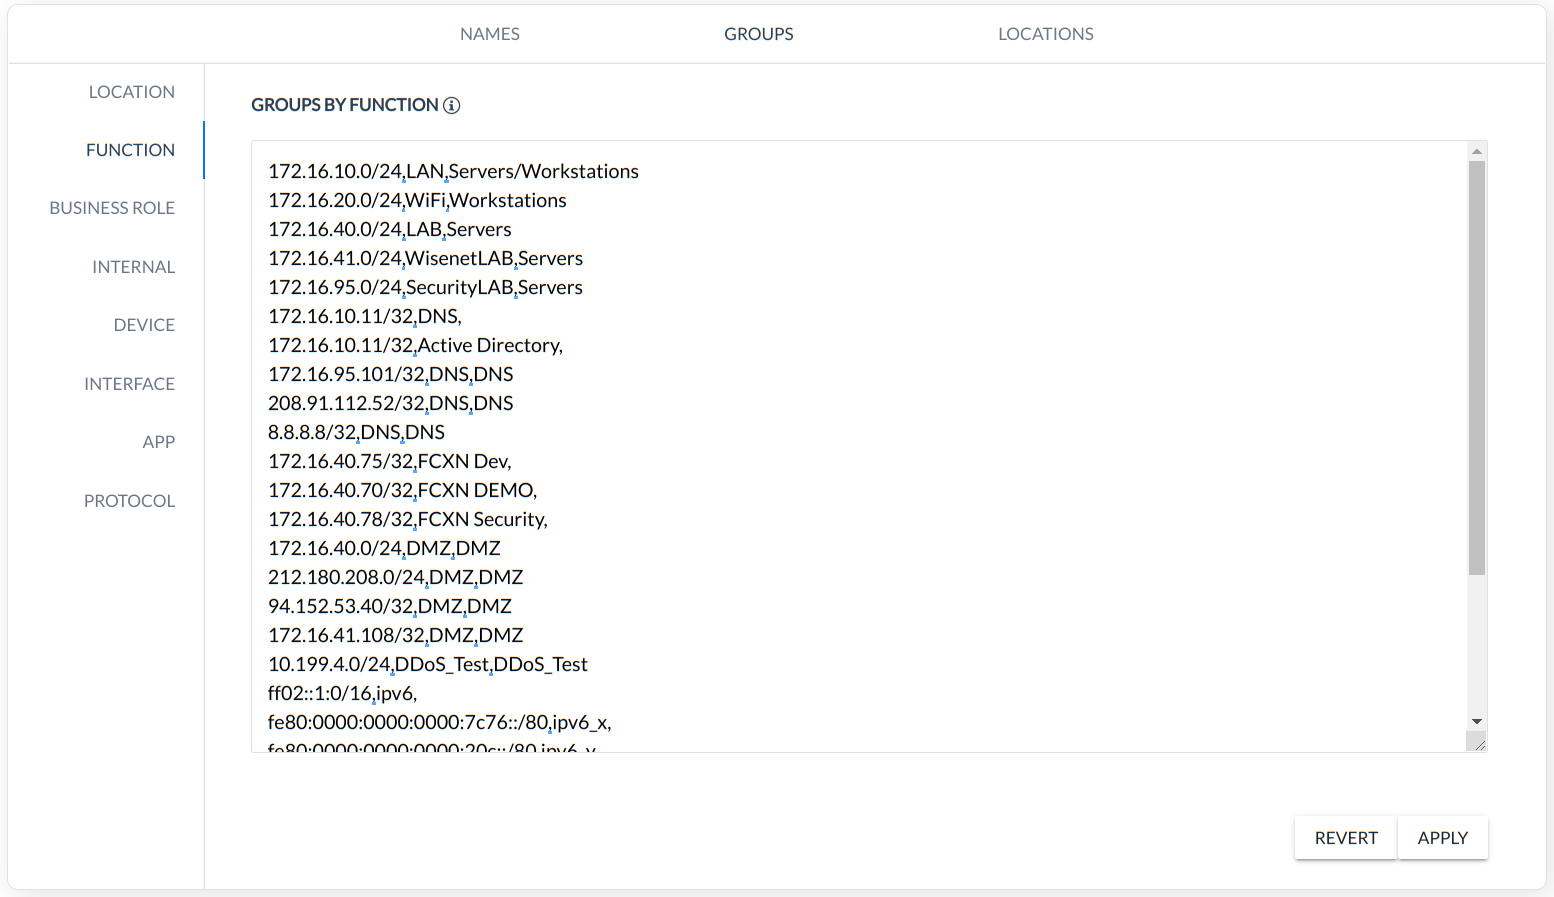
FUNCTION - grouping based on NETWORK logical function (CIDR, Name, Description),
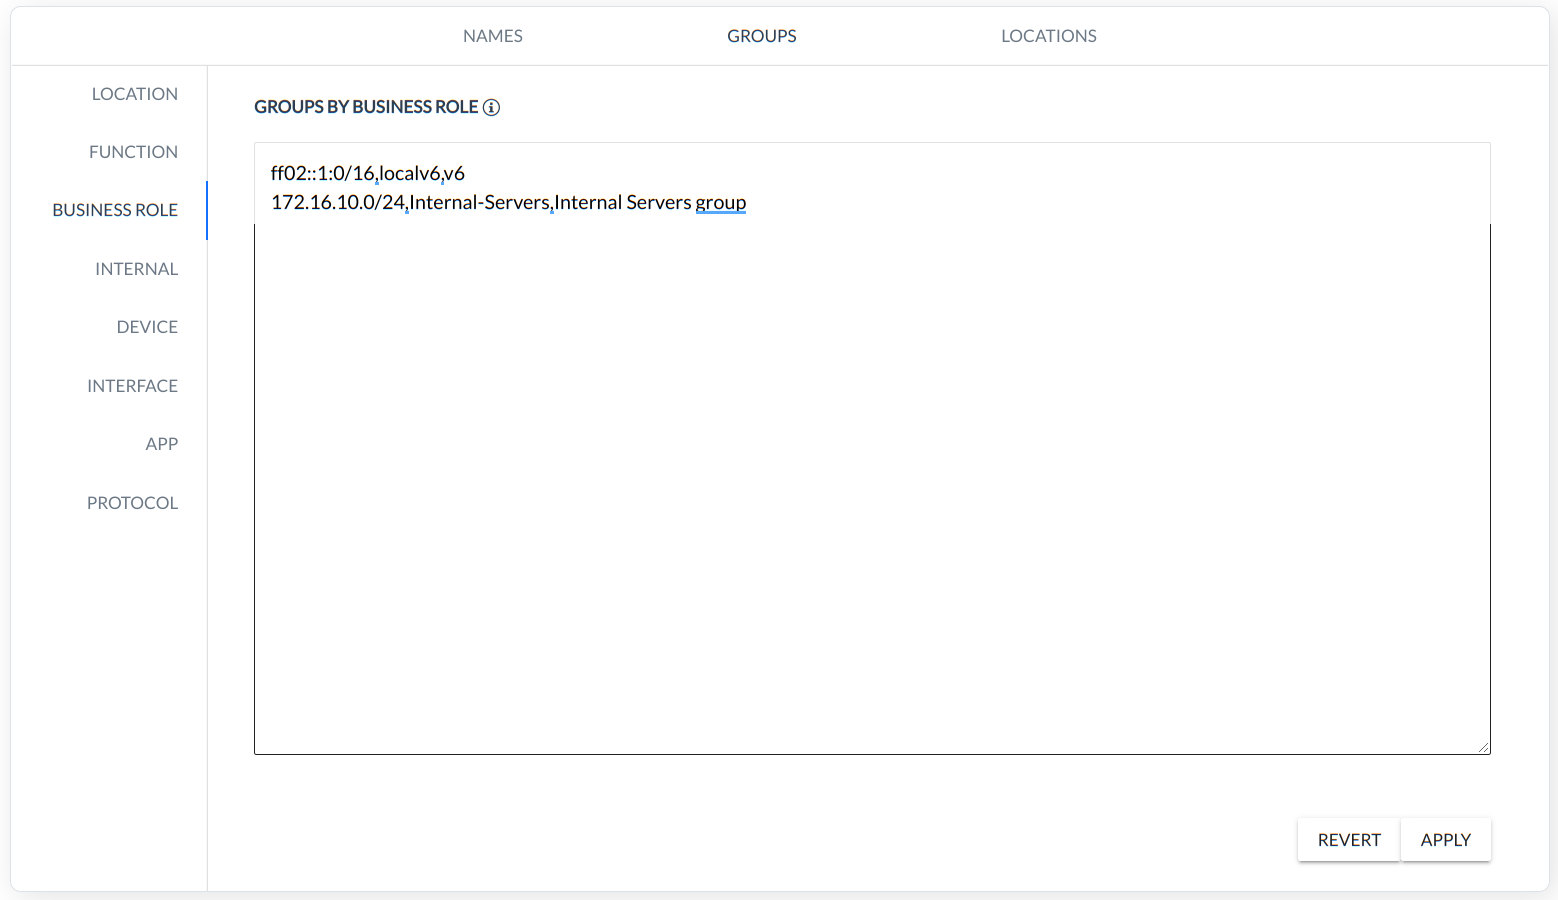
BUSINESS ROLE - grouping based on NETWORK business role in Organization (CIDR, Name, Description),
INTERNAL - grouping based on internal Classless Inter-Domain Routing (CIDR),
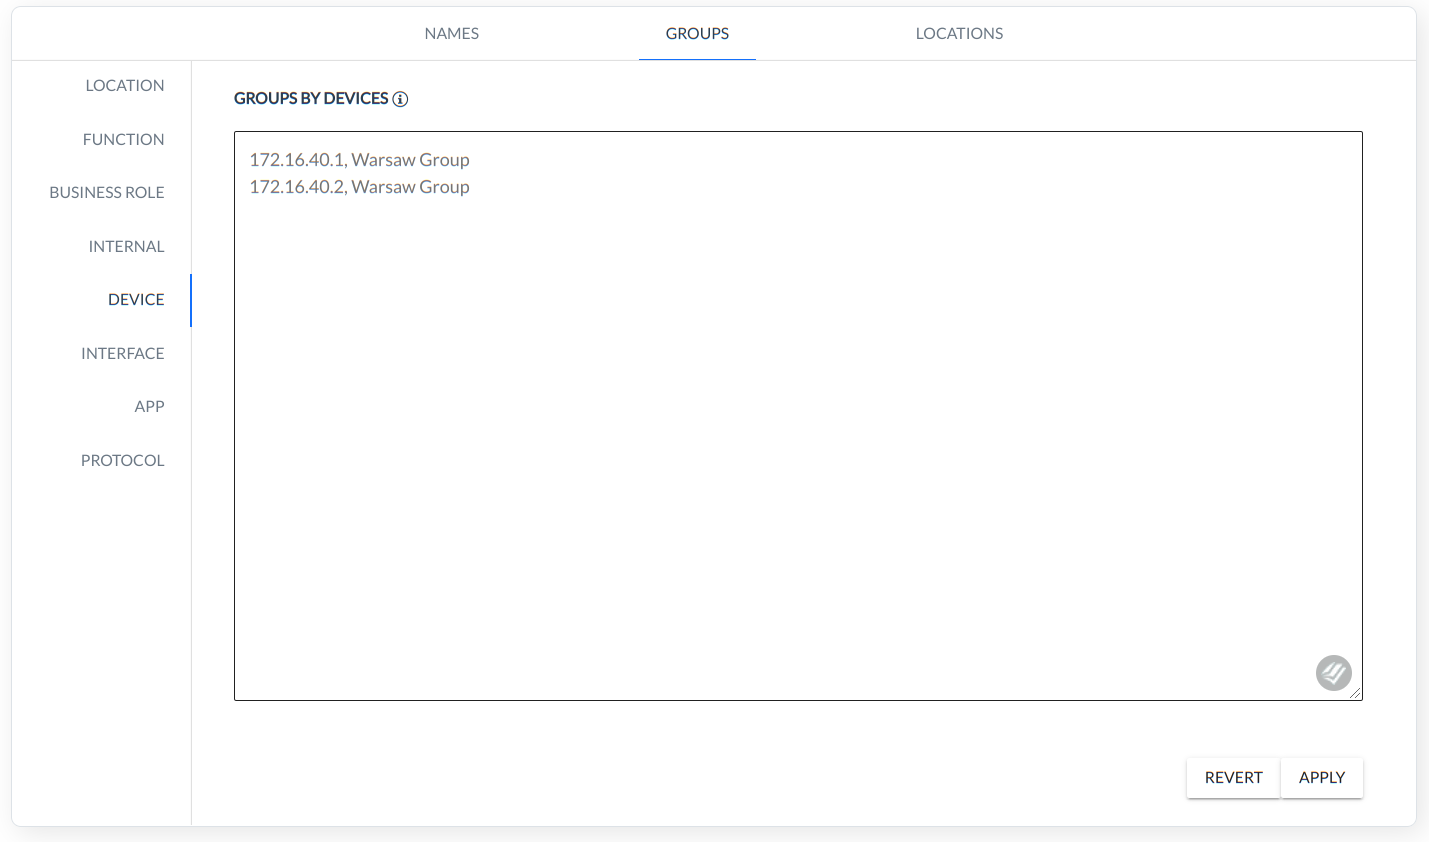
DEVICE - grouping based on internal Classless Inter-Domain Routing (CIDR),
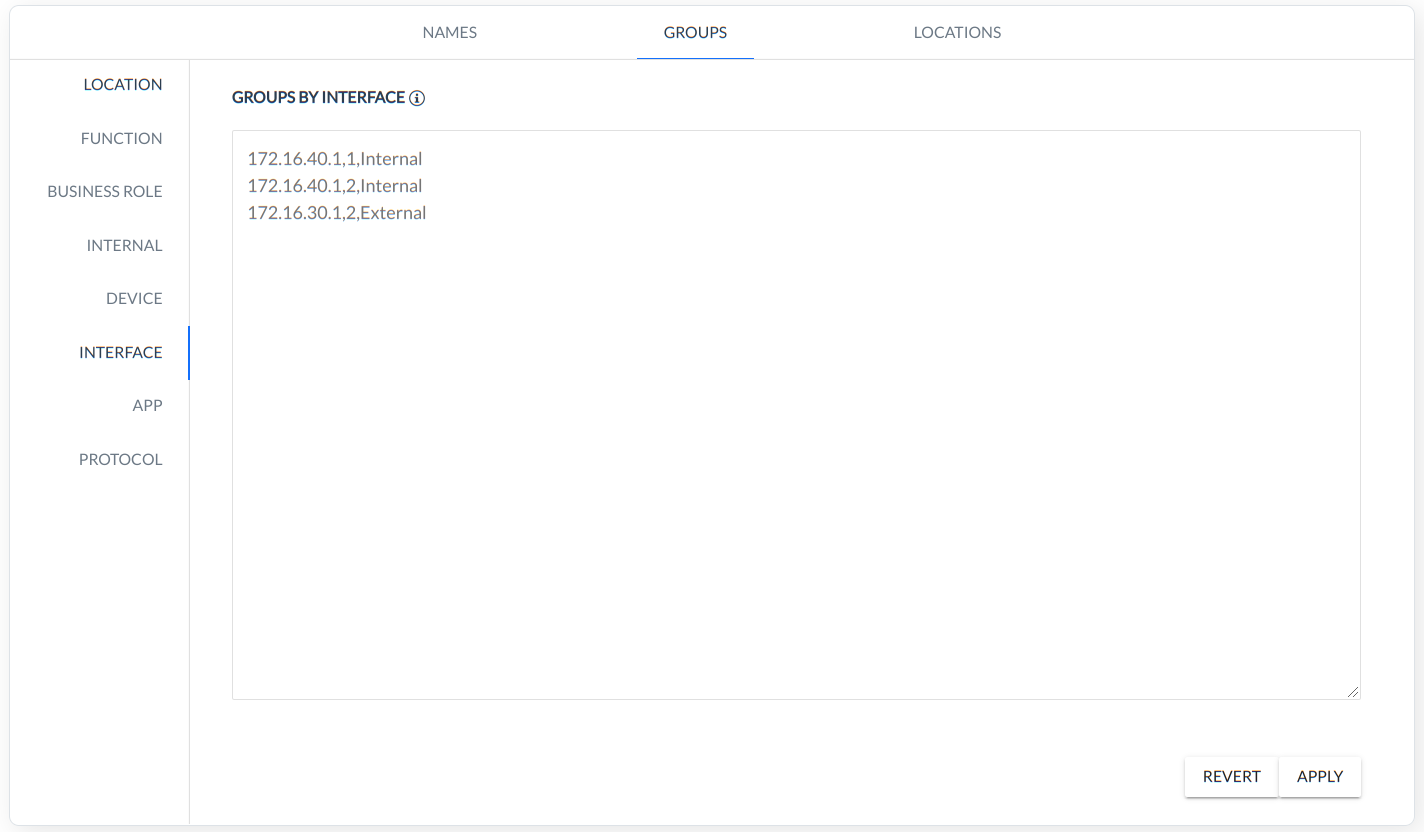
INTERFACE - grouping based on physical interfaces ip,
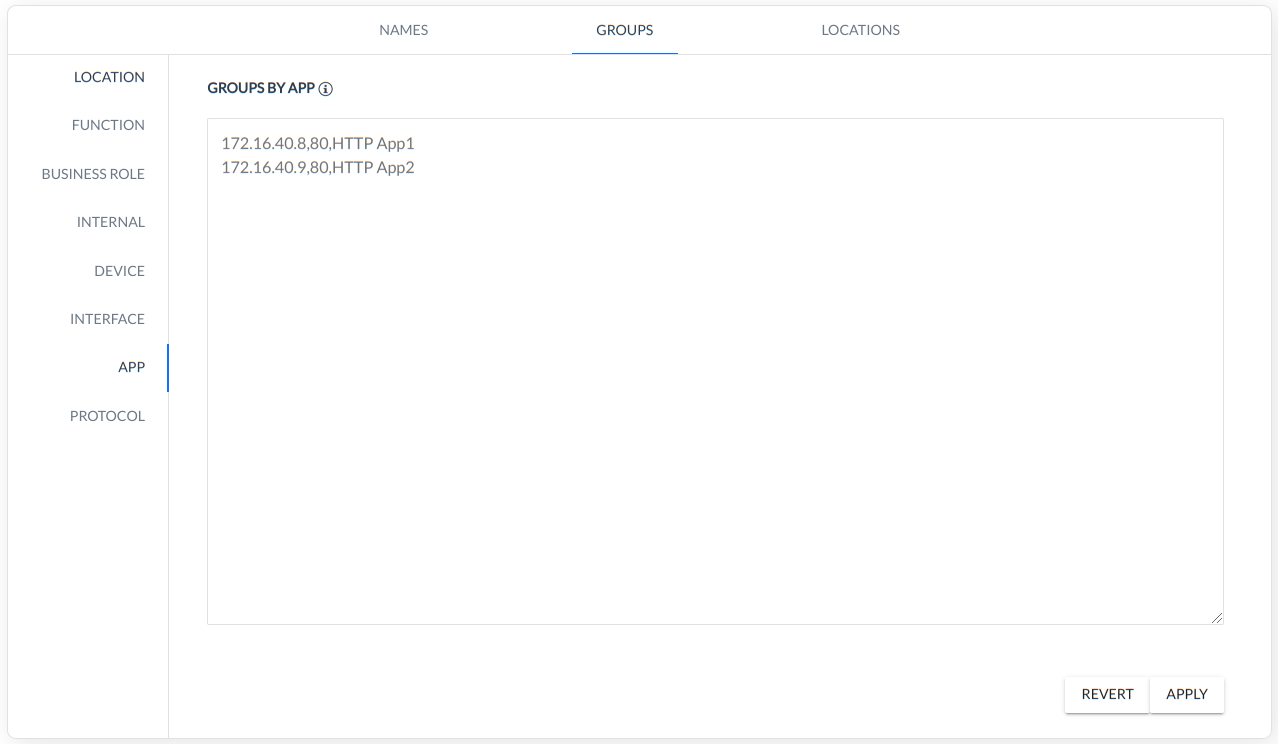
APP - grouping based on applications,
PROTOCOL - grouping based on protocol.
Note: Grouping is very useful for presentation purposes as well as for implementation verification of widely used security zone segmentation concepts, utilized for both traffic filtering and risk mitigation.
Since the release 1.6 of the FlowControl system, it has been possible to group (as above) base on:
- Device
- Interface
- App
- Protocol
New groupings have caused the following new fields to appear in all views in the XN module:
- "Protocol Group"
- "Source Application Group"
- "Destination Application Group"
- "Device Group"
- "Input Interface Group"
- "Output Interface Group"
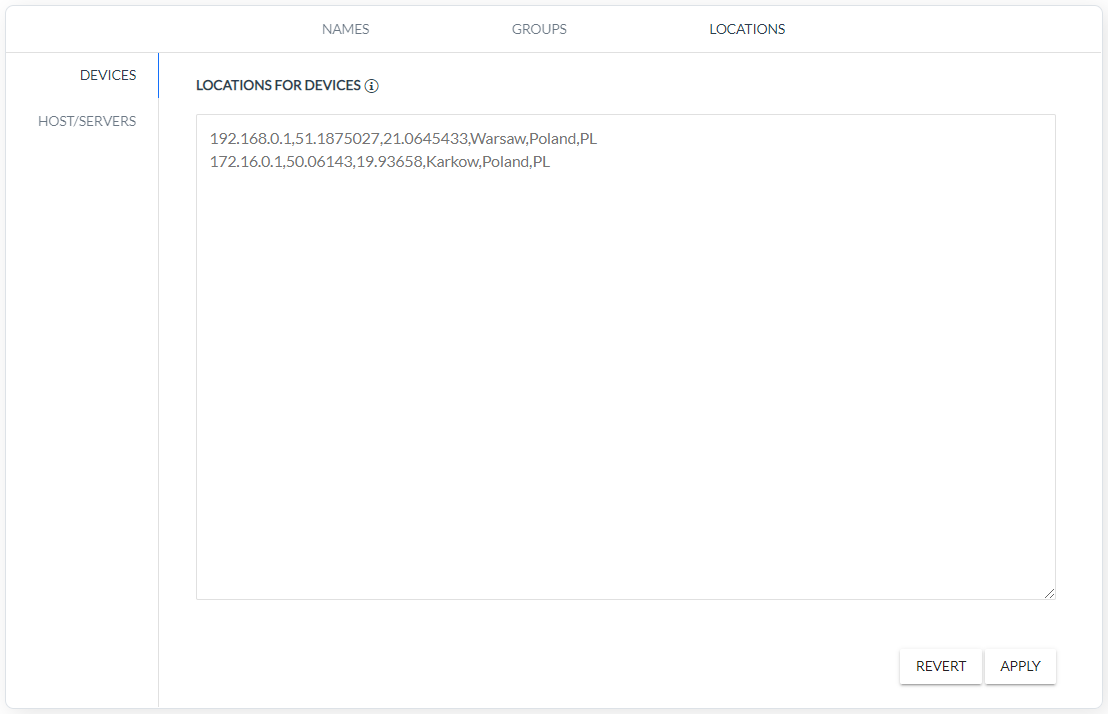
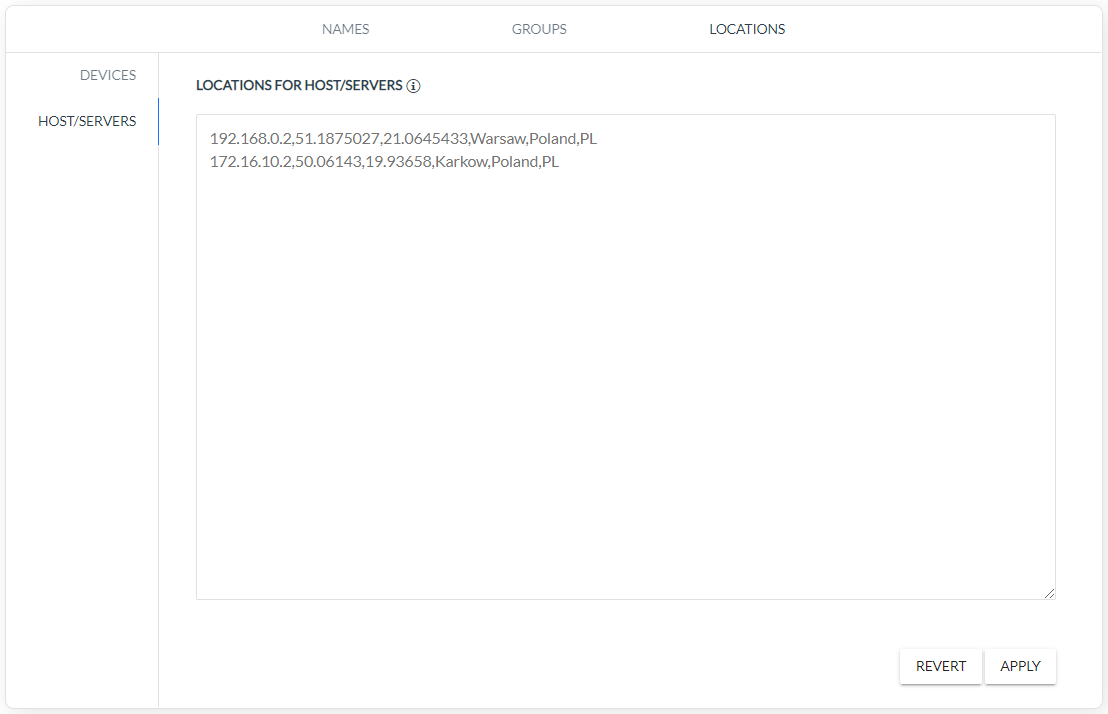
LOCATIONS - users can assign geographic coordinates to the following data objects:
DEVICES - rule defines coordinates to the DEVICE IP (Device IP, Longitude, Attitude, City, Country, Country Code).
HOST/SERVERS - rule defines coordinates to the HOST/SERVER IP (Host/Server IP, Longitude, Attitude, City, Country, Country Code).
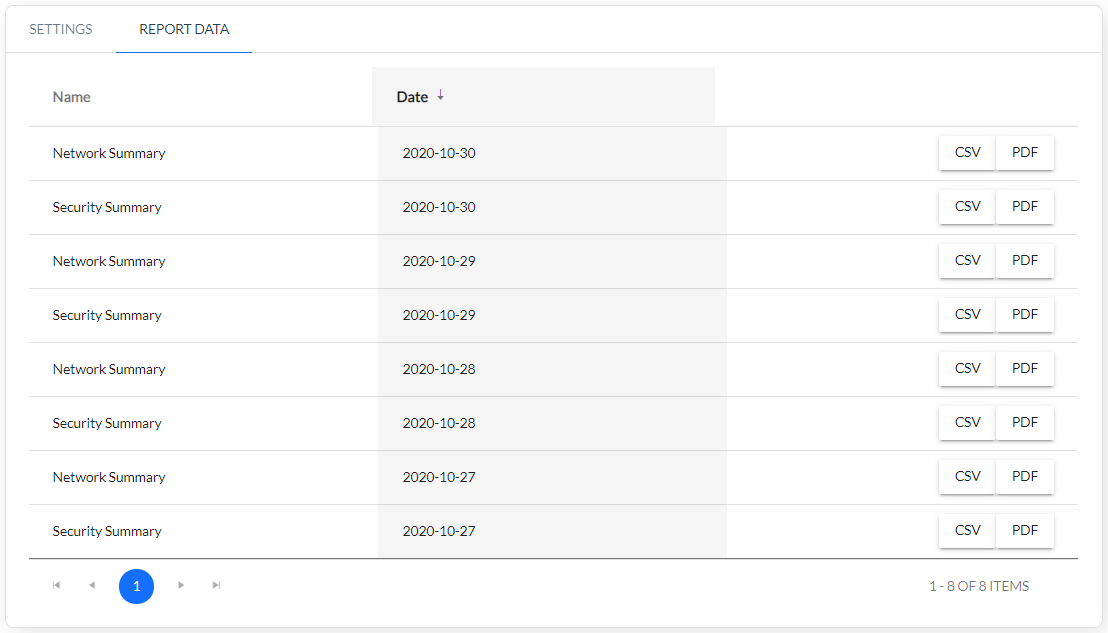
Reports
This system is preconfigured with four report templates which can be enabled/disabled on request:
- Security Summary - summary of detected security threats from the last day,
- Network Traffic Report - overview of top talkers and devices,
- Interface Utilization - top interfaces and threshold violations,
- Application Servers - view on the most used application servers.
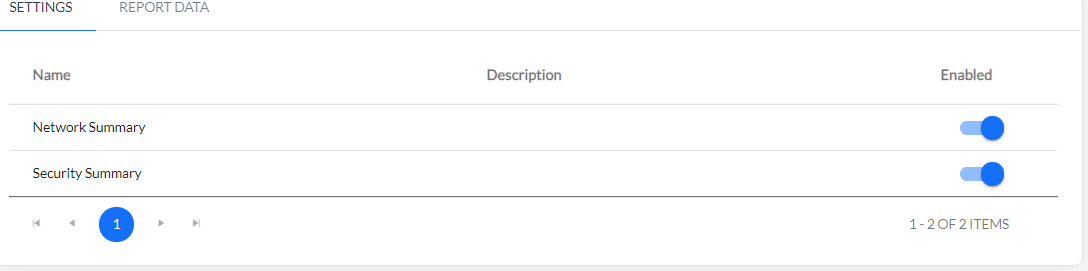
Reports are run on a daily basis and the outcome is saved and visible in a list form from the UI.